
Analyzing the Wikipedia clickstream just got easier with WikiNav
By Muniza A, Isaac Johnson, and Martin Gerlach
What articles are most likely to lead readers to the Astrology article (Hint: the clicks are Fast and Furious.)? What topics are readers most interested in after reading about velociraptors, and how do those topics change across languages (For example, do readers only go to English Wikipedia to learn about the Fighting Dinosaurs fossil)?
These are just some of the questions that can be answered by the Wikipedia clickstream, a publicly available dataset that shows how readers in Wikipedia get to an article and where they go from there. Wikipedia clickstream consists of weighted (source, destination) pairs extracted from the internal pageview logs of Wikipedia. This data is maintained in 11 languages and is updated every month, thanks to Wikimedia’s Data Engineering team. Analyzing this data is a multi-step process that involves downloading it, getting familiar with its structure, finding the right tools and methods to process it, and choosing appropriate visualizations for it.
In order to make answers to questions like those above accessible to everyone, and not just data scientists or folks with programming knowledge, we’ve created a visualization tool called WikiNav. This tool was developed as part of an Outreachy-internship from May to August 2021.
About WikiNav
WikiNav processes the Wikipedia clickstream to generate various visualizations, each of which focuses on a certain aspect of the data. This can help users get to insights faster, eliminating the need for them to crunch the numbers themselves.
- What paths do readers take to or from a Wikipedia article?
WikiNav generates a Sankey chart that can visualize the top sources and destinations to and from an article and indicates the percentage of views sent or received by each source and destination.
- How does the composition of traffic change from month to month?
WikiNav plots an article’s traffic for the current month alongside its traffic from the previous month which can help visualize the changes in the nature of traffic over time.
- How does the composition of traffic differ across languages?
Users can also visualize how sources and destinations to and from an article change across different languages. This is done by looking up the top sources and destinations for the current article across clickstream data for selected languages.
For these questions and others, explore your favorite articles at https://wikinav.toolforge.org.
Technical details
Our aim for WikiNav was to create an interface that was reasonably fast and responsive without requiring extensive computational resources and that could be used by people with varying levels of programming experience.
The project started out in the form of a Jupyter notebook on PAWS during the Outreachy initial contribution round. This posed two issues:
- Since all of the data could not be loaded into memory at once, it had to be processed in chunks or be looped over, which was slow.
- Published PAWS notebooks are static, so visualizing other articles would still require Python knowledge and a Mediawiki account.
This led to our current setup as described below:
API
Wikinav API resides on a Cloud VPS instance along with the clickstream SQLite files. We chose SQLite because of its small footprint, hassle-free configuration, portability, and low read latency. Converting a whole clickstream snapshot to SQLite takes a small Python script and a few minutes, and we’ve set up a cron job that does this every time a new snapshot becomes available. Since we’re only concerned with reads here, we did not have to worry about concurrent writes which are serialized in SQLite and might pose a problem if your application is write-heavy. As of now, the WikiNav API provides access to the latest two snapshots of the clickstream data due to limited storage on the VPS.
Requests to the WikiNav API are handled by Nginx which acts as a reverse proxy for Gunicorn. This ensures that requests from and responses to slow clients are buffered and provides added benefits such as production-grade load balancing, caching, and enhanced security. Gunicorn is a WSGI HTTP server that processes requests from a web server such as Nginx and then communicates those requests to Flask. Finally, depending on the URL of the request and the parameters supplied with it, Flask creates an SQL query for the clickstream SQLite files, sorts the results, extracts the requested subset from them, and returns them in the form of a JSON response.
Frontend
The frontend for WikiNav is hosted on Toolforge. It acts as a dashboard for the clickstream data by generating statistics and visualizations for it and provides features that allow users to interact with and manipulate those visualizations. We chose React for developing the frontend since there is a lot of data flowing between visualizations and this data needs to be updated frequently. React simplifies the management of this state and helps make the process of updating and rerendering the visualizations a lot more efficient.
The WikiNav app lets users select a language and title of interest and then queries the WikiNav API to get the relevant data for generating visualizations for the user’s selection. It also makes additional calls to other APIs such as the MediaWiki API to obtain contextual information about the title (for example, the corresponding titles in other languages).
Challenges
Getting our data from multiple APIs meant that we had to make multiple asynchronous HTTP requests for every article. Streamlining those requests, managing the flow of responses across components, and handling errors associated with each source required some refactoring. We also made sure to cache API responses so that two components asking for the same data don’t result in repeated requests and, as a result, higher load times.
Another challenge was making sure that our API could keep up with the interactivity of our frontend. This required experimentation with different database structures and settings so that we could perform fast lookups on the clickstream data.
Example: comparing languages
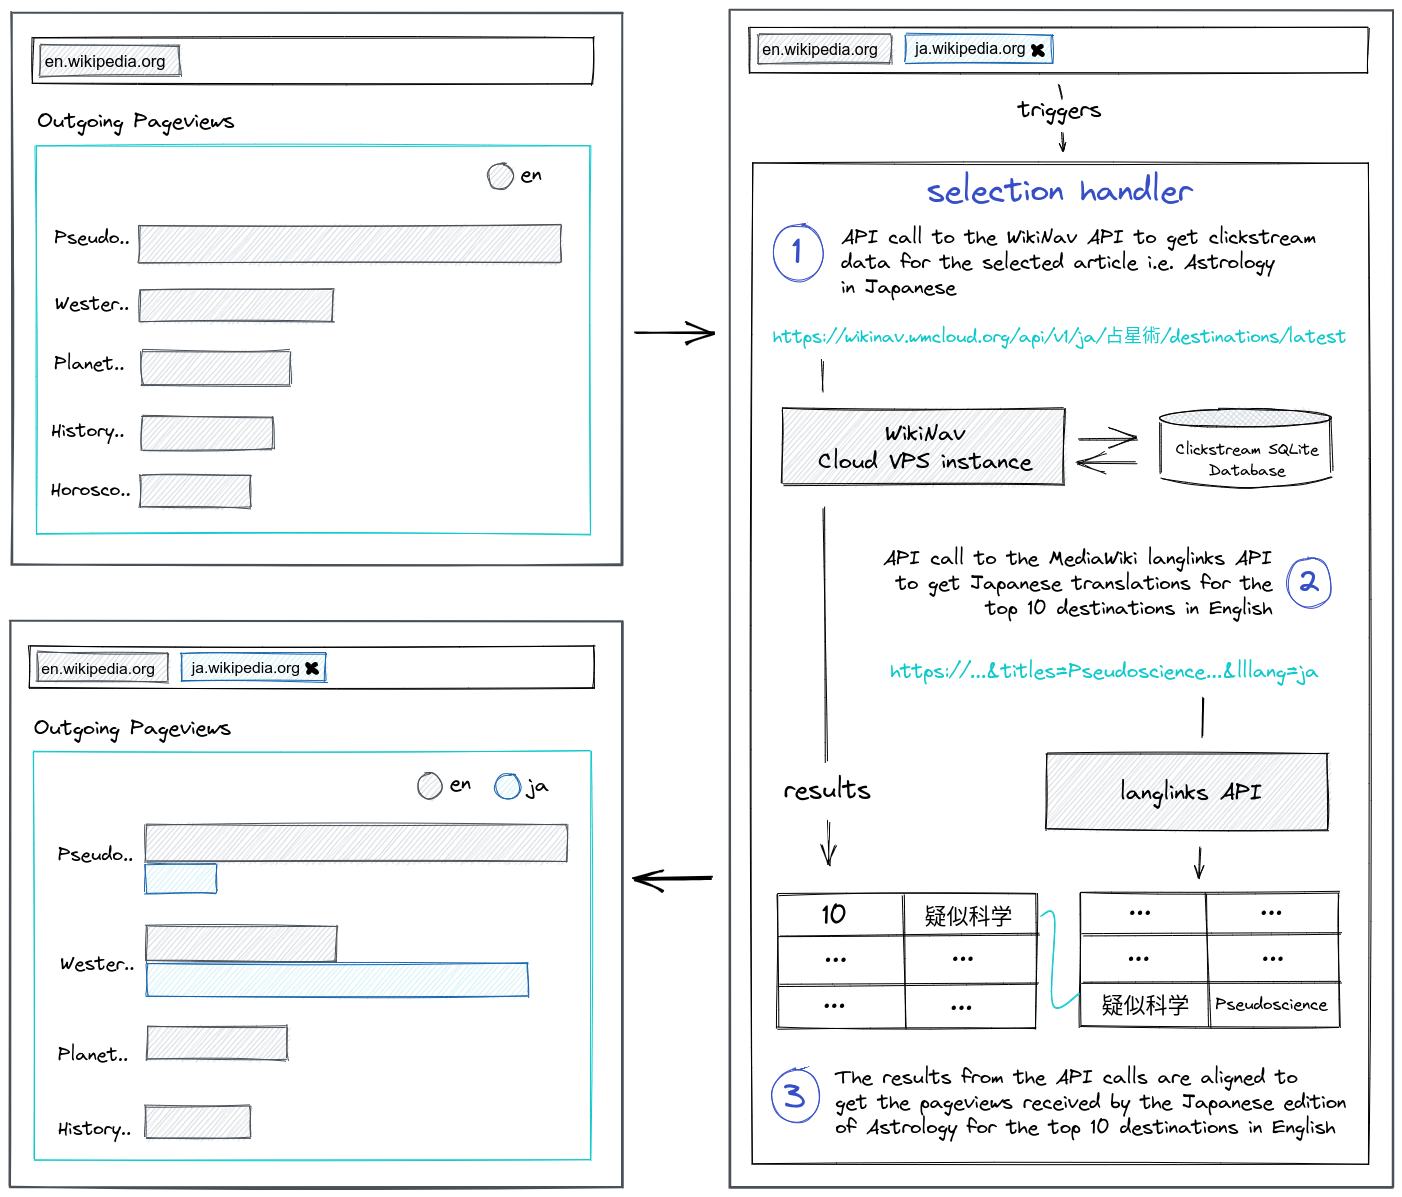
To see this setup in action, here’s an example featuring the language comparison charts.
Each time you add a new language to compare, a handler fires queries to the WikiNav API to get the sources and destinations for the current title in the selected language. It also sends requests to the Wikipedia Langlinks API to get translations for the top sources and destinations in the selected language. Once done, it aligns the results from those API calls to get new datasets for the incoming and outgoing pageviews bar charts, respectively.
Explore further
Ready to explore further? You can check out the WikiNav-tool yourself. In addition, you can see the clickstream data visualized in-situ on Wikipedia articles with this user script that uses WikNav’s API. If you have additional suggestions on how to improve the tool, you can leave feedback on the talk page on meta or comment directly on the GitHub repository containing the source code and documentation.
Thanks to the Data Engineering and Cloud Services teams for their support around data and infrastructure and to the Outreachy program providing the opportunity for this project as part of an internship.
About this post
Featured image credit: File:Sextante, Acervo do Museu Paulista da USP (6).jpg, José Rosael/Hélio Nobre/Museu Paulista da USP, CC BY-SA 4.0
.jpg)
Hi Muniza,
Thanks for sharing insight about wikinav. I was not aware about that.
Have a great day!