

Performance testing in a controlled lab environment – the metrics
By Peter Hedenskog, Senior Software Engineer, Wikimedia Performance Team
Maybe you remember our hiring tweet from a couple of years ago?

If we are slow, we waste users time. And we don’t want to do that. That’s why we are really serious about the performance of Wikipedia.
Performance metrics
In an earlier post, Timo told us that there are two ways of collecting web performance metrics: Directly from our users, called real user measurements (RUM) or in a controlled lab environment (synthetic testing).
Getting metrics from real users is good because they are close to what people really experience. The problem is that:
- Today’s browsers have limited ways of giving us metrics that tell us what the user is experiencing. A couple of browsers have a metric called First Paint (when something is first painted on the screen). But the rest of the metrics are more technical. They tell us how the browser is doing, not what the user is experiencing. Browser vendors are working on this but, at the moment, most performance APIs are focused on technical metrics. And we’re more interested in what our users are experiencing.
- Metrics from real users have a lot of variation because the users have different conditions: network latency, operating system, browser version, CPU and more. If something changes, how do we know the main reason? Is it our code? Is it something else?
- There is a lot of noise in the data we collect from real users. To catch a performance regression, it needs to be big enough and affect many users to be visible.
That’s why we also test in a lab environment.
Performance testing in a lab
Testing in a lab means that we are running a desktop computer (or mobile) in an isolated environment where we try to have the environment as stable as possible. That way we hope that we are able to pick up small performance regressions and know why we have that regression.
In a lab environment we have more control and we love control when we want to measure things! We want to make the conditions between tests to be as similar as possible. If we can control the environment, we can find regressions introduced by our code changes.
Testing in a lab environment helps us with:
- Collecting metrics that are more related to user experience than the technical metrics the browsers provide. In this post we will focus on the specific metrics we get from the lab environment.
- In a controlled environment that typically provides consistent test results, it is easier to detect regressions. It’s easier to spot smaller regressions than with RUM.
- Lab testing and RUM are best friends: our synthetic testing improves our confidence in RUM and vice versa. If we see a regression in both types of measurements, we know for sure that it’s a real regression.
- We can see changes very quickly when testing in a lab setting, because the only variable that is changing is the code. Being confident in RUM usually takes more time: you need to have more data to see the change.
- In a lab setting, we are also able to control when browser versions are updated to new versions, allowing us to detect when browser releases impact user experience. Our users’ browsers auto updates. A new browser version can affect the performance.
But everything isn’t perfect when testing in a lab: We are only testing a small usage group (a specific browser version, specific connection type, one operating system, a couple of URLs). We will miss out on a lot of users scenarios. That’s the big disadvantage of testing in a lab. That’s why it is also important to collect metrics from real users.
Metrics in our lab
One of the things I like with testing in a lab is that we can get more user centered metrics than we can get directly from the browser. We mostly focus on visual metrics.
Visual metrics
Visual metrics are when things that happens within the viewport of the browser that the user can see. We collect these metrics by recording a video of the browser screen and then analyzing the video and calculating the metrics.
What’s good with visual metrics is that it is easy to see and understand and easy to relate. They are the best metrics we have today to know what the user is experiencing.
However visual metrics doesn’t tell the full story: Only focusing on visuals we miss out on when the page “feels” ready. What do we mean by “feel”? JavaScript that gets executed after the screen is painted can make the page feel slow/laggy. You try to interact with the page but nothing happens. Today we don’t have a good way to measure that “feeling”, but there have been different attempts in the performance industry to fix that. There is ongoing work on metrics like Time To Interaction and other interaction metrics trying to know when it is possible for the user to interact with the page. But at the moment no browser supports them natively and, in my opinion, these metrics are not yet mature enough to use.
First Visual Change
First visual change is when something is first painted within the viewport of the browser screen. For Wikipedia on desktop this mostly means going from a complete blank screen to something like this:

Depending on your internet connection the first visual change may not include the image. Other than that, this is what the first change looks like for most users. If you have another case, please submit an issue in Phabricator with screenshots and your setup so we can reproduce and add more test cases.
On mobile the first visual change looks something like this:

Showing content (text/images) early is important, since the earlier you can see the text as a reader, the sooner you can start to read and get the information you want.
First visual change also correlates to the RUM metric first paint. We can see that the first visual change and first paint happen at almost the same time. That means that if we see a change in first paint in RUM, we will also see the change in first visual change in synthetic testing.
Speed Index
Speed Index was invented by Patrick Meenan, the creator of WebPageTest:
“The Speed Index is the average time at which visible parts of the page are displayed. It is expressed in milliseconds and dependent on size of the viewport.”
The idea with Speed Index is to measure when the entire content within the browser viewport is ready. Speed Index will be lower if the entire page renders more quickly, but it will also be lower if partial content renders sooner. If two pages finish rendering at the same time, the page that started to render first will have the lowest Speed Index.
We use Speed Index to know when when the page looks ready for the user. However the page can still download assets and run JavaScript, so it could be that the page looks ready but doesn’t feel ready (it’s not responsive if you to click on a link).
Last Visual Change
Last visual change is when everything within the viewport is ready on the screen. It could be images coming in late or JavaScript in one extension changing the layout of the already painted screen.
We don’t act on last visual change today because it is really dependent on what page we test, what browser we use to test the page, and other factors. But it is an important metric: if the page starts to change when you want to interact with it, you will not know if the page is ready to use or not.
Visual Complete 85/95/99
We also collect metrics when the page is 85, 95 and 99% complete. The intent of these metrics is to account for content-related factors that result in changes to overall page load times. For example, when Wikipedia is running fundraising campaigns, there is a donation banner that appears on most pages on the site. These donation banners are intentionally loaded after most of the content has loaded, but they do result in the last visual change being pushed back quite a bit. By measuring the time that it takes for the page to be 85% complete instead, we avoid the variation that this introduces.
Visual Elements
The last one of our visual metrics are the ability to measure when specific elements is painted on the screen. We can get metrics like when is the largest image painted? When is the logo? We have started to collect these metrics in our tools but haven’t yet started to act on them.
CPU time spent metrics
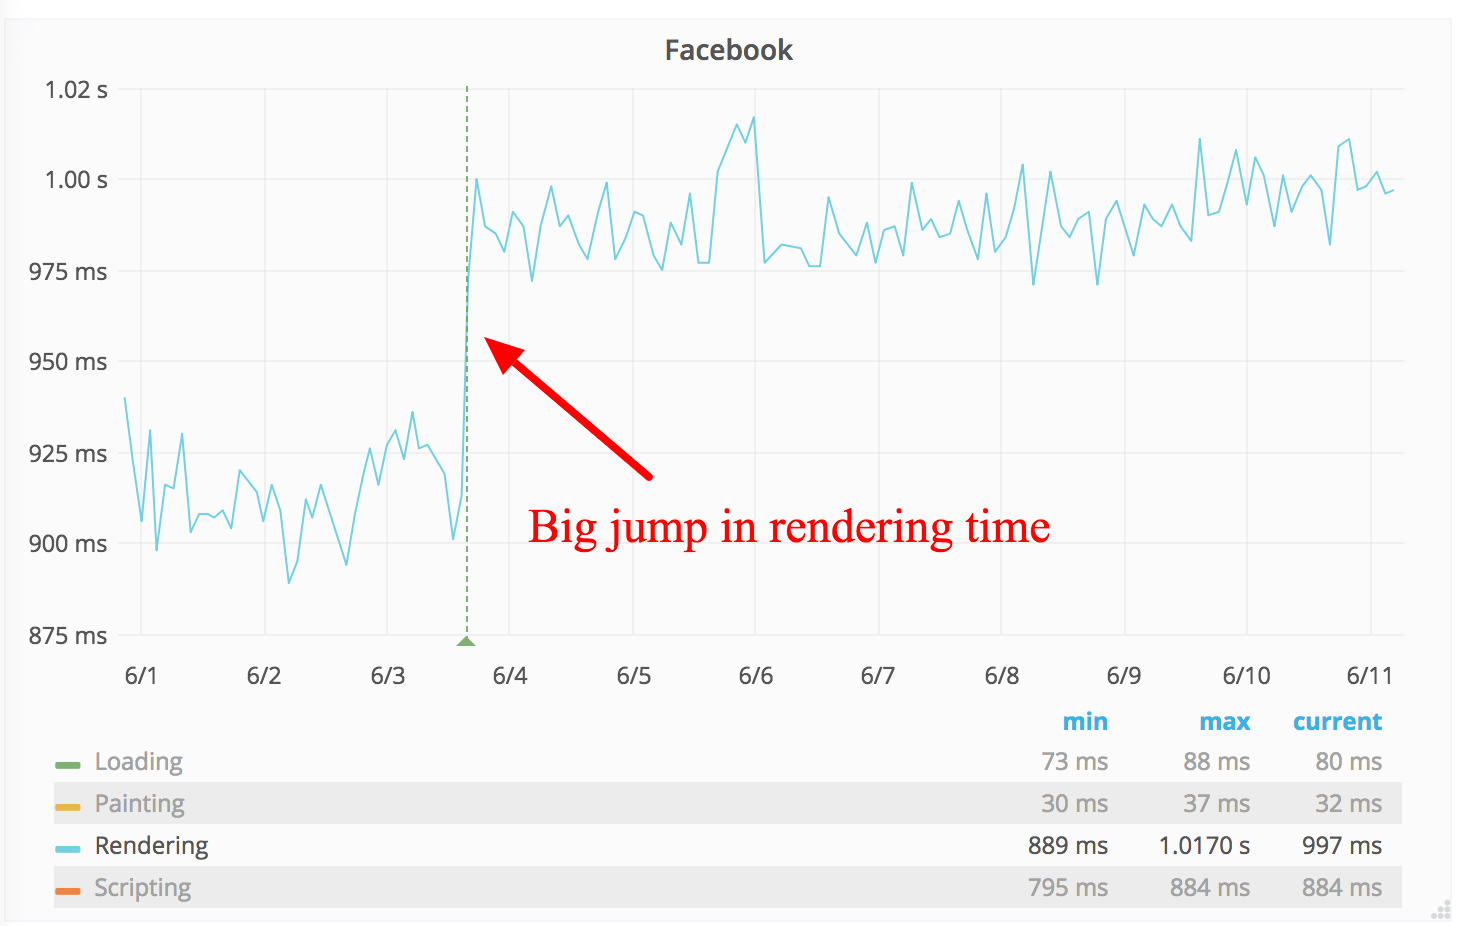
Another type of metric that we use in the lab is CPU time spent in the browser. Today we can only get that from Chrome. We configure and collect the event trace log from Chrome and categorise the events on a high level.
We can then see time spent on painting, rendering, scripting and loading. If we get a regression, we can then go down to a lower event level and use that to better understand what is actually happening.
Deviation
One important meta metric that we also collect is the standard deviation of each metric that we collect. That helps us know how stable the metrics we have are and if we need to tune anything in our setup. It also helps us understand if we have certain pages that are extra hard to measure (that have a lot of variation). This is something that I’ll talk about more in my next post, when we discuss the ways that we control our synthetic testing environment.
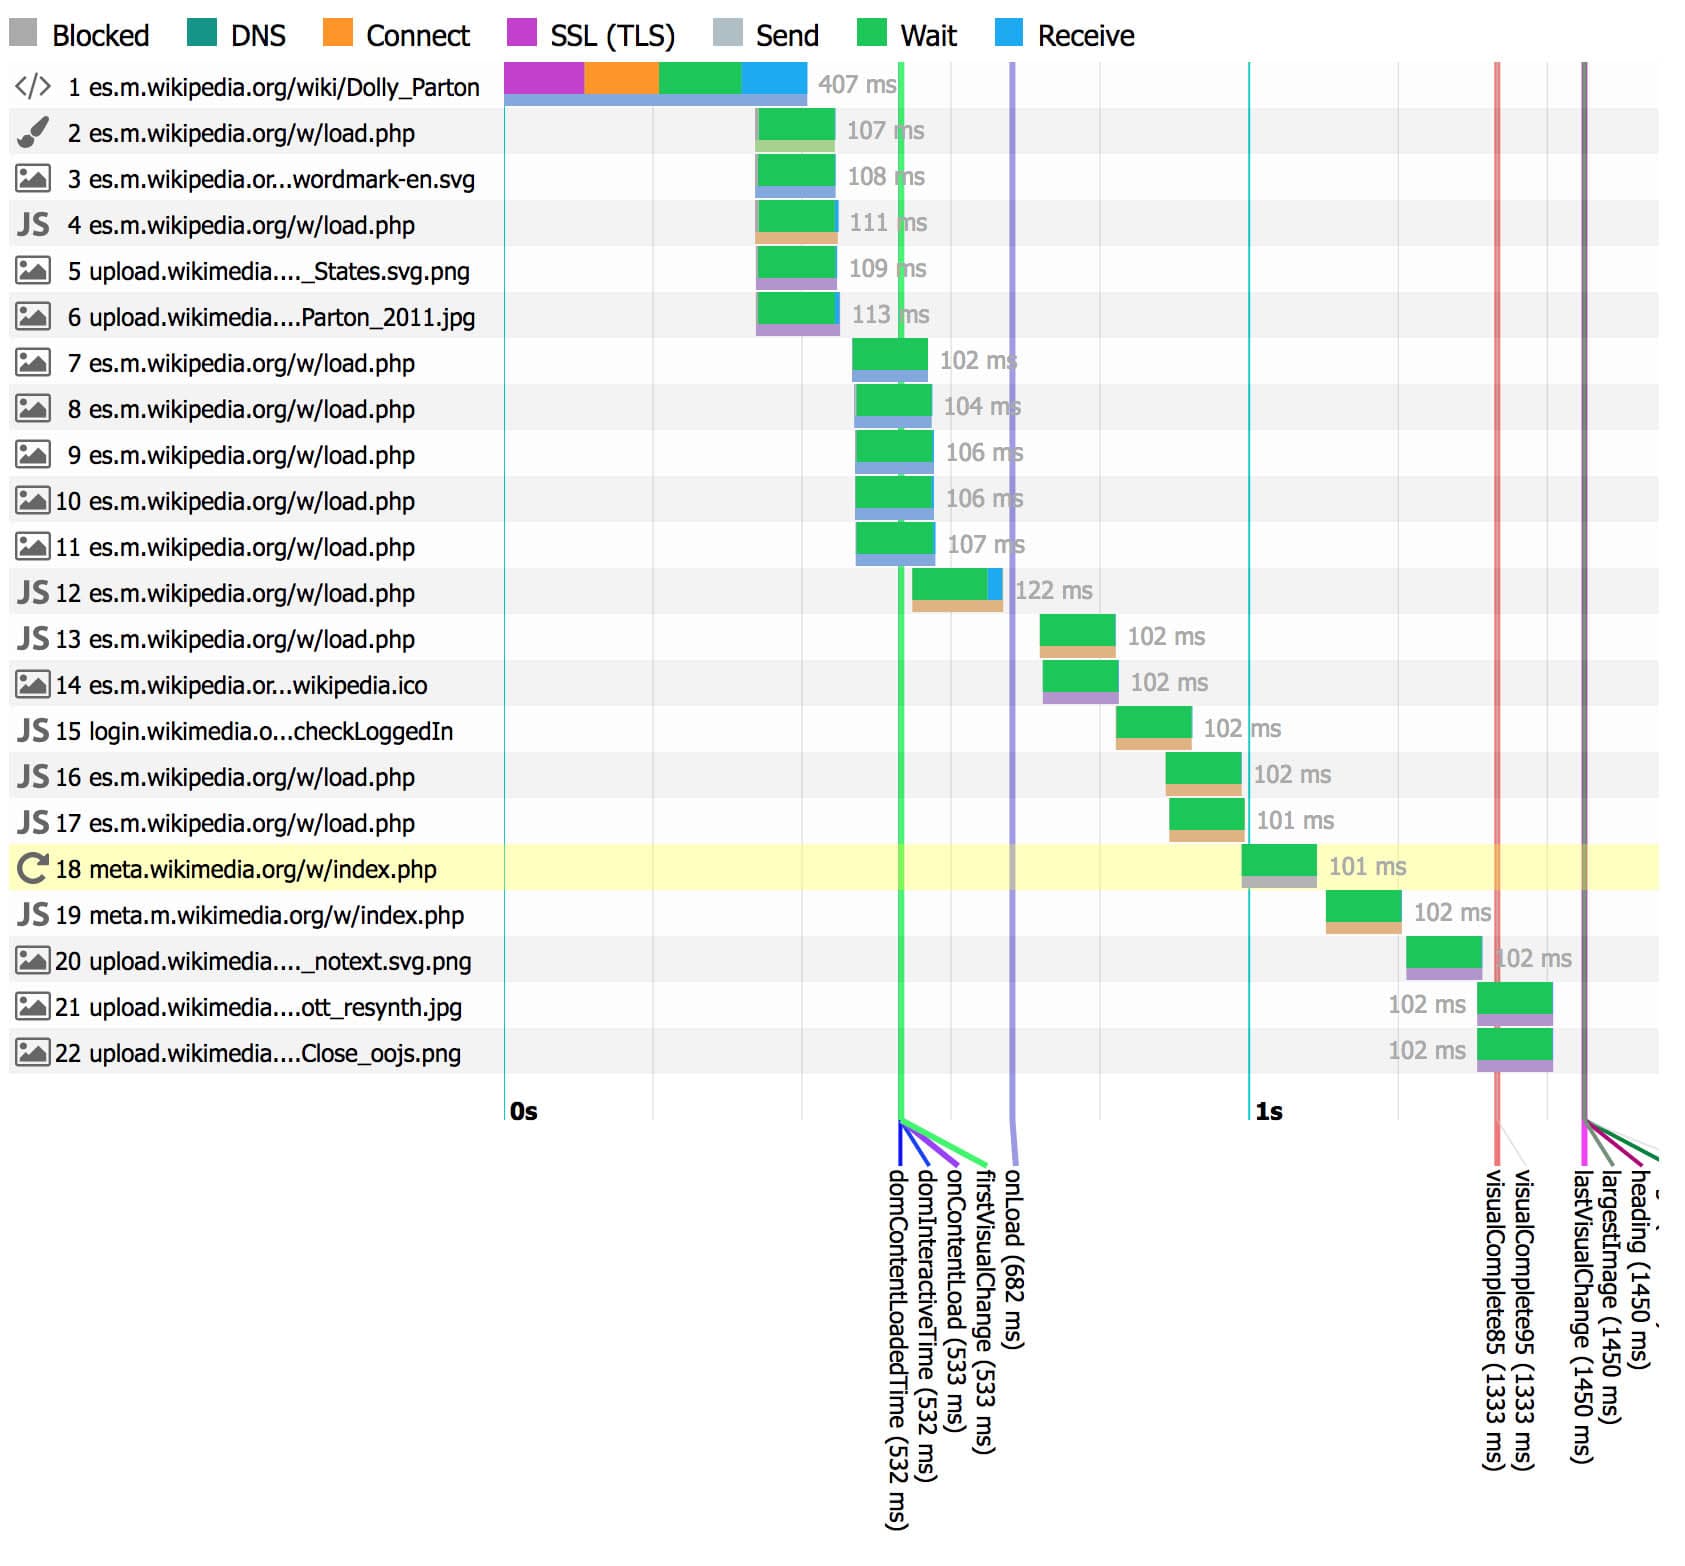
Page snapshots
Our synthetic testing also helps us with knowing how our pages were constructed at a given time. We collect number of requests, the size of each response, the response type and how the browser downloaded all responses every time we measure a page. That helps us when we find a regression. We can compare the before and after (what did the page look like before the regression?).
We also collect screenshots and videos of what the page looked like at the time we measured the page.
Summary
We focus on visual metrics and CPU time spent metrics in our synthetic testing. The visual metrics give us a better feel for what the user is experiencing than most of the metrics we collect from real users. Our synthetic testing also gives us a snapshot of what the page looked like at the moment we measured it. The problem with synthetic measuring is that we try out only a small portion of users’ different setups.
In the next blog post I will talk about our technical setup, problems we have had, and strategies we are using to get stable metrics.
About this post
This post was originally published on the Wikimedia Performance Team Phame blog.
Featured image credit: Laboratório – laboratory, Chokniti Khongchum, CC0 1.0