
A better Toolforge, part 2: a technical deep dive
By Arturo Borrero Gonzalez and Brooke Storm, Wikimedia Cloud Services
In the previous post, we shared the context on the recent Kubernetes upgrade that we introduced in the Toolforge service. Today we would like to dive a bit more in the technical details.
Custom admission controllers
One of the key components of the Toolforge Kubernetes are our custom admission controllers. We use them to validate and enforce that the usage of the service is what we intended for. Basically, we have 2 of them:
- Ingress admission controller [source code]
- Registry admission controller [source code]
The source code is written in Golang, which is pretty convenient for natively working in a Kubernetes environment. Both code repositories include extensive documentation: how to develop, test, use, and deploy them. We decided to go with custom admission controllers because we couldn’t find any native (or built-in) Kubernetes mechanism to accomplish the same sort of checks on user activity.
With the Ingress controller, we want to ensure that Ingress objects only handle traffic to our internal domains, which by the time of this writing, are toolforge.org (our new domain) and tools.wmflabs.org (legacy). We safe-list the kube-system namespace and the tool-fourohfour namespace because both need special consideration. More on the Ingress setup later.
The registry controller is pretty simple as well. It ensures that only our internal docker registry is used for user-scheduled containers running in Kubernetes. Again, we exclude from the checks containers running in the kube-system namespace (those used by Kubernetes itself). Other than that, the validation itself is pretty easy. For some extra containers we run (like those related to Prometheus metrics) what we do is simply upload those docker images to our internal registry. The controls provided by this admission controller helps us validate that only FLOSS software is run in our environment, which is one of the core rules of Toolforge.
RBAC and Pod Security Policy setup
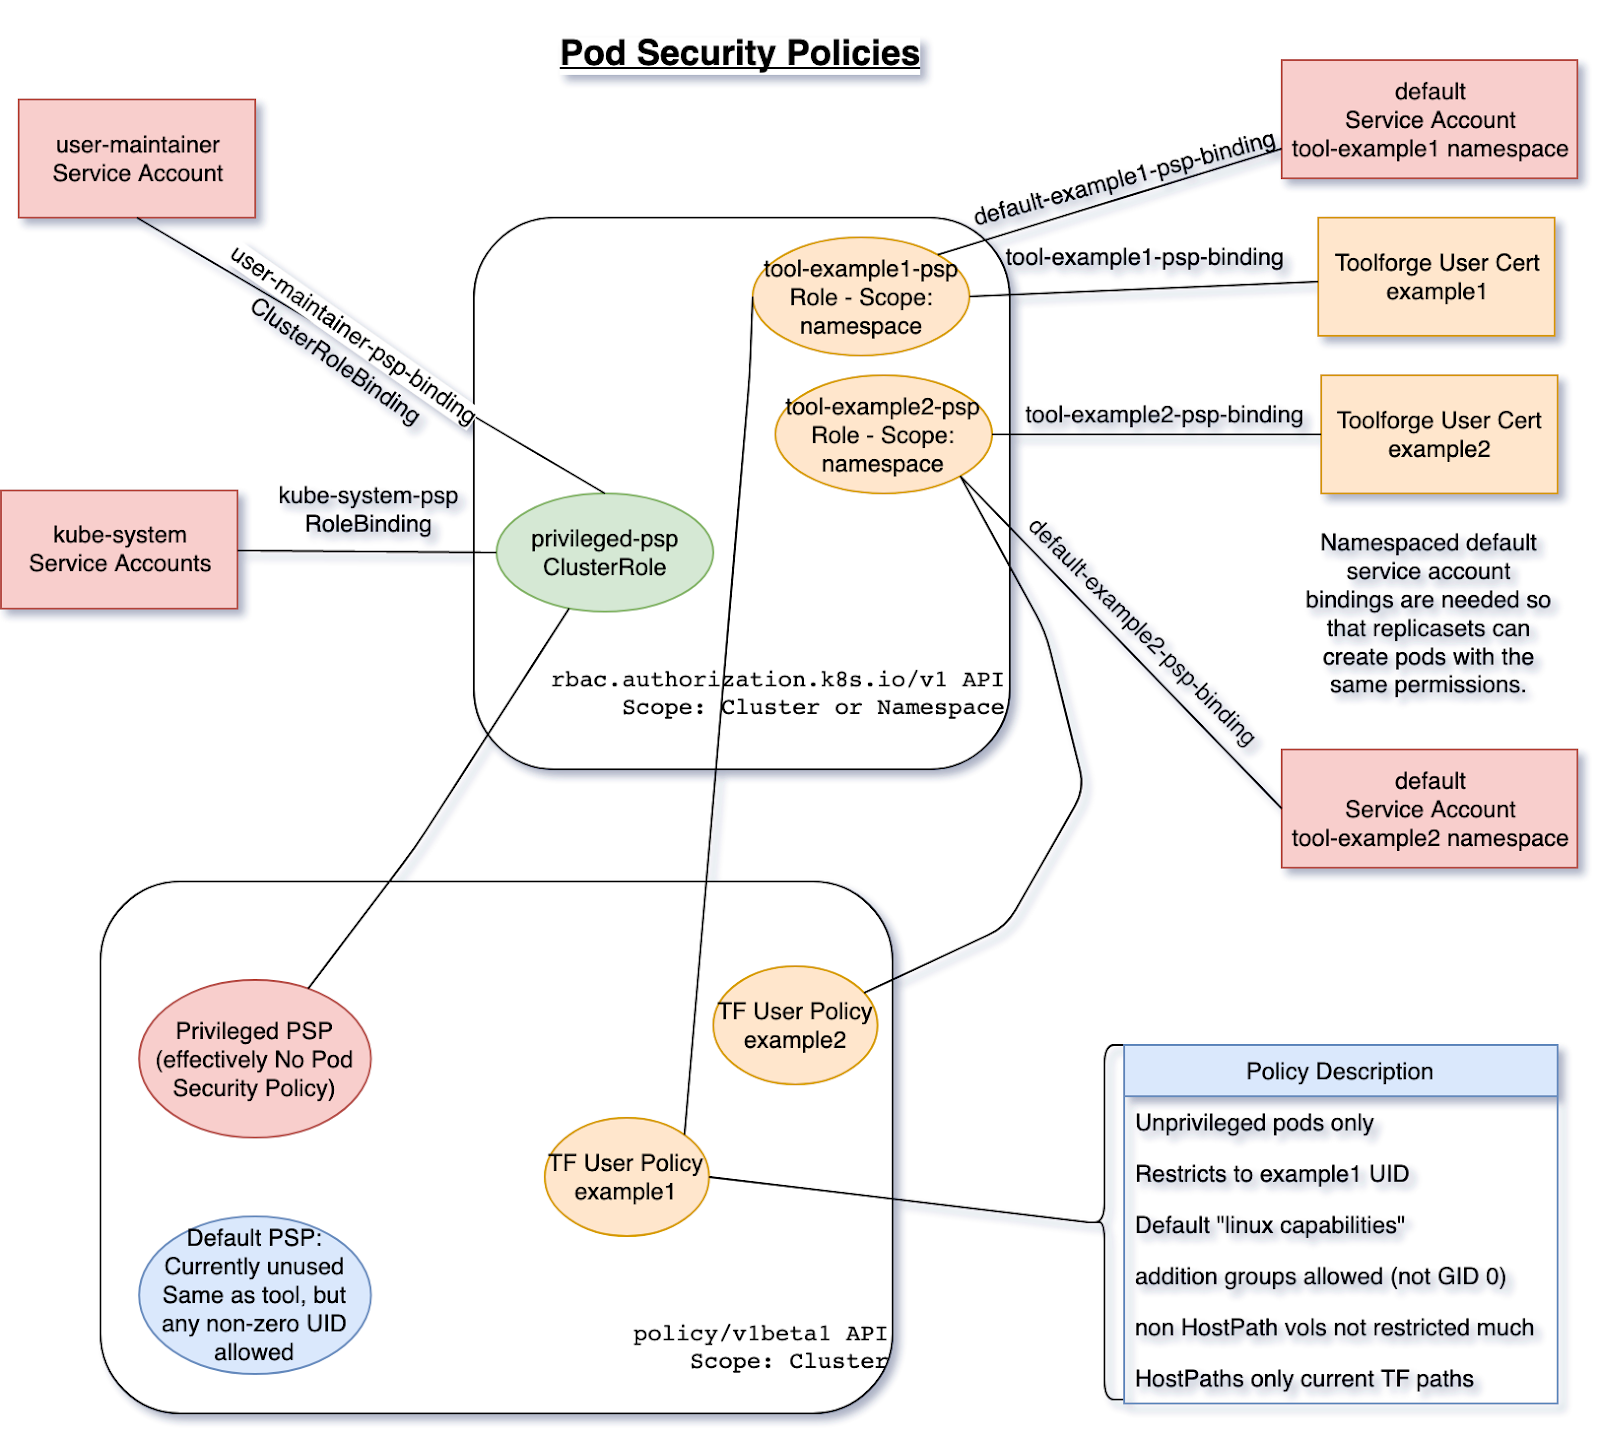
I would like to comment next on our RBAC and Pod Security Policy setup. Using the Pod Security Policies (or PSP) we establish a set of constraints on what containers can and can’t do in our cluster. We have many PSP configured in our setup:
- Privileged policy: used by Kubernetes containers themselves—basically a very relaxed set of constraints that are required for the system itself to work.
- Default policy: a bit more restricted than the privileged policy, is intended for admins to deploy services, but it isn’t currently in use..
- Toolforge user policies: this applies to user-scheduled containers, and there are some obvious restrictions here: we only allow unprivileged pods, we control which HostPath is available for pods, use only default Linux capabilities, etc.
Each user can interact with their own namespace (this is how we achieve multi-tenancy in the cluster). Kubernetes knows about each user by means of TLS certs, and for that we have RBAC. Each user has a rolebinding to a shared cluster-role that defines how Toolforge tools can use the Kubernetes API. The following diagram shows the design of our RBAC and PSP in our cluster:
I mentioned that we know about each user by means of TLS certificates. This is true, and in fact, there is a key component in our setup called maintain-kubeusers. This custom piece of Python software is run as a pod inside the cluster and is responsible for reading our external user database (LDAP) and generating the required credentials, namespaces, and other configuration bits for them. With the TLS cert, we basically create a kubeconfig file that is then written into the homes NFS share, so each Toolforge user has it in their shell home directory.
Networking and Ingress setup
With the basic security controls in place, we can move on to explaining our networking and Ingress setup. Yes, the Ingress word might be a bit overloaded already, but we refer here to Ingress as the path that end-users follow from their web browser in their local machine to a webservice running in the Toolforge cluster.
Some additional context here. Toolforge is not only Kubernetes, but we also have a Son of GridEngine deployment, a job scheduler that covers some features not available in Kubernetes. The grid can also run webservices, although we are encouraging users to migrate them to Kubernetes. For compatibility reasons, we needed to adapt our Ingress setup to accommodate the old web grid. Deciding the layout of the network and Ingress was definitely something that took us some time to figure out because there is not a single way to do it right.
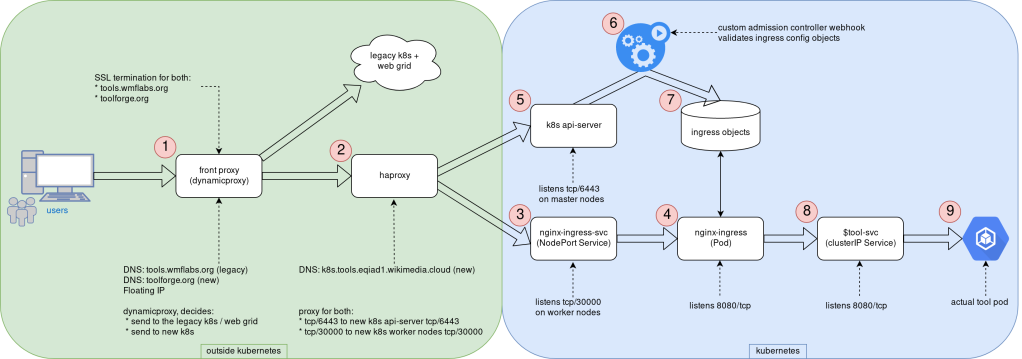
The following diagram can be used to explain the different steps involved in serving a web service running in the new Toolforge Kubernetes.
The end-user HTTP/HTTPs request first hits our front proxy in (1). Running here is NGINX with a custom piece of LUA code that is able to decide whether to contact the web grid or the new Kubernetes cluster. TLS termination happens here as well, for both domains (toolforge.org and tools.wmflabs.org). Note this proxy is reachable from the internet, as it uses a public IPv4 address, a floating IP from CloudVPS, the infrastructure service we provide based on Openstack. Remember that our Kubernetes is directly built in virtual machines–a bare-metal type deployment.
If the request is directed to a webservice running in Kubernetes, the request now reaches haproxy in (2), which knows the cluster nodes that are available for Ingress. The original 80/TCP packet is now translated to 30000/TCP; this is the TCP port we use internally for the Ingress traffic. This haproxy instance provides load-balancing also for the Kubernetes API as well, using 6443/TCP. It’s worth mentioning that unlike the Ingress, the API is only reachable from within the cluster and not from the internet.
We have a NGINX-Ingress NodePort service listening in 30000/TCP in every Kubernetes worker node in (3); this helps the request to eventually reach the actual NGINX-Ingress pod in (4), which is listening in 8080/TCP. You can see in the diagram how in the API server (5) we hook the Ingress admission controller (6) to validate Kubernetes Ingress configuration objects before allowing them in for processing by NGINX-Ingress (7).
The NGINX-Ingress process knows which tools webservices are online and how to contact them by means of an intermediate Service object in (8). This last Service object means the request finally reaches the actual tool pod in (9). At this point, it is worth noting that our Kubernetes cluster uses internally kube-proxy and Calico, both using Netfilter components to handle traffic.
Tools-webservice
Most user-facing operations are simplified by means of another custom piece of Python code: tools-webservice. This package provides users with the webservice command line utility in our shell bastion hosts. Typical usage is to just run webservice start|stop|status. This utility creates all the required Kubernetes objects on-demand like Deployment, ReplicaSet, Ingress and Service to ease deploying web apps in Toolforge. Of course, advanced users can interact directly with Kubernetes API and create their custom configuration objects. This utility is just a wrapper, a shortcut.
Tool-fourohfour and tool-k8s-status
The last couple of custom components we would like to mention are the tool-fourohfour and tool-k8s-status web services. These two utilities run inside the cluster as if they were any other user-created tool. The fourohfour tool allows for a controlled handling of HTTP 404 errors, and it works as the default NGINX-Ingress backend. The k8s-status tool shows plenty of information about the cluster itself and each tool running in the cluster, including links to the Server Admin Log, an auto-generated grafana dashboard for metrics, and more.
For metrics, we use an external Prometheus server that contacts the Kubernetes cluster to scrape metrics. We created a custom metrics namespace in which we deploy all the different components we use to observe the behavior of the system:
- metrics-server: used by some utilities like kubectl top.
- kube-state-metrics: provides advanced metrics about the state of the cluster.
- cadvisor: to obtain fine-grained metrics about pods, deployments, nodes, etc.
All the Prometheus data we collect is used in several different Grafana dashboards, some of them directed for user information like the ones linked by the k8s-status tool and some others for internal use by us the engineers. These are for internal use but are still public, like the Ingress specific dashboard, or the cluster state dashboard. Working publicly, in a transparent way, is key for the success of CloudVPS in general and Toolforge in particular. Like we commented in the previous post, all the engineering work that was done here was shared by community members.
By the community, for the community
We think this post sheds some light on how the Toolforge Kubernetes service works, and we hope it could inspire others when trying to build similar services or, even better, help us improve Toolforge itself. Since this was first put into production some months ago we detected already some margin for improvement in a couple of the components. As in many other engineering products, we will follow an iterative approach for evolving the service. Mind that Toolforge is maintained by the Wikimedia Foundation, but you can think of it as a service by the community for the community. We will keep an eye on it and have a list of feature requests and things to improve in the future. We are looking forward to it!
About this post
Featured image credit: USS Constellation (1854) ship’s wheel, Richard N Horne, CC BY-SA 4.0
_ship%E2%80%99s_wheel.jpg)
Read the 1st part of the series here: A better Toolforge, part 1: upgrading the Kubernetes cluster