

Profiling PHP in production at scale
By Timo Tijhof, Principal Performance Engineer
At Wikipedia, we built an efficient sampling profiler for PHP, and use it to instrument live requests. The trace logs and flame graphs are powered by a simple setup that involves only free open-source software and runs at low infrastructure cost.
I’d like to demonstrate that profiling doesn’t have to be expensive, and can even be performant enough to run continually in production! The principles in this article should apply to most modern programming languages. We developed Excimer, a sampling profiler for PHP; and Arc Lamp for processing stack traces and generating flame graphs.
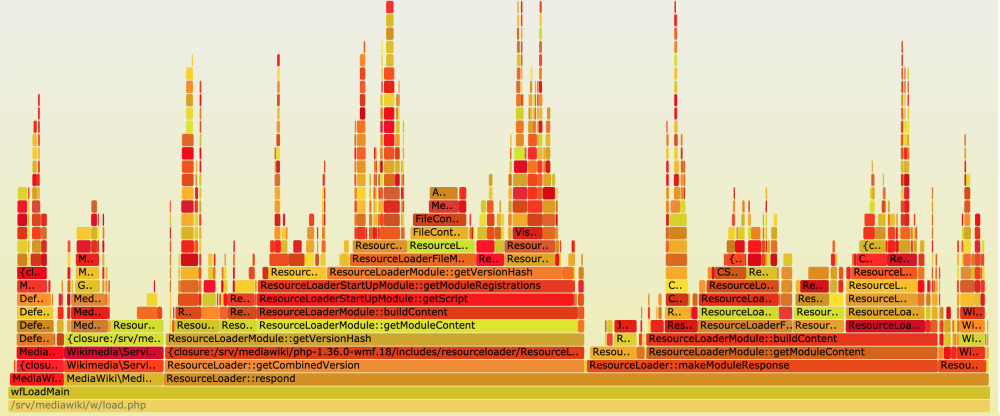
Exhibit A: The Flame Graph
Our goal is to help developers understand the performance characteristics of their application through flame graphs. Flame graphs visually describe how and where an application spends its time. You may have seen them while using the browser’s developer tools, or after running an application via a special tool from the command-line.
Profilers often come with a cost – code may run much more slowly when a profiler is active. This cost is fine when investigating something locally or ad-hoc, but it’s not something we always want to apply to live requests.
To generate flame graphs, we sample stack traces from web servers that are serving live traffic. This is achieved through a sampling profiler. We then send the stack traces to a stream, which is then turned into a flame graph.
Our target was to add less than 1 millisecond to user-facing web requests that complete within 50ms or 200ms, and add under 1% to long-running processes that run for several minutes.
And so our journey begins, with the quest for an efficient sampling profiler.
How profiling can be expensive
Internal entry and exit hooks
XHProf (and Tideways) is a native extension for PHP. It intercepts the start and end of every function call and may record function hierarchy, call count, memory usage, etc. When used as a debugger to trace an entire request, it can slow down your application by 3X (+200%). [1]
It has a sampled mode in which its entry-exit hooks are reduced to no-ops most of the time, and otherwise records only a stack trace. But this could still run code 10-30% slower. The time spent within these hooks for “no-op” cases was fairly small. But, the act of switching to and from such a hook has a cost as well. And, when we intercept every single function in an application, those costs quickly add up.
We also found that the mere presence of these entry-exit hooks prevented the PHP engine from using certain optimisations. When evaluating performance, compare not only a plugin being used vs not, but also compare to a system with the plugin being entirely uninstalled!
We also looked at external ways to capture stack trace samples, using GDB, or perf_events.
External interrupts
GDB unlocks the full power of the Linux kernel to halt a process in mid-air, break into it, run your code in its local state, and then gets out to let the process resume – all without the process’ awareness. [2]
GDB does this through ptrace, which comes with a relatively high interrupt cost. But, the advantage of this approach is that there is no overhead when the profiling is inactive. Initial exploration showed that taking a single sample could delay the process by a whole second while GDB attached and detached itself. There was some room for improvement here (such as GDB preloading), but it seemed inevitable that the cost would be magnitudes too high.
perf_events
perf_events is a Linux tool that can inspect a process and read its current stack trace. As with GDB, when we’re not looking, the process runs as normal. perf_events takes samples relatively quickly, has growing ecosystem support, and its cost can be greatly minimised.
If your application runs as its own compiled program, such as when using C or Rust, then this solution might be ideal. But, runtimes that use a virtual machine (like PHP, Node.js, or Java), act as an intermediary process with their own way of managing an application’s call stack. All that perf_events would see is the time spent inside the runtime engine itself. This might tell you how internal operations like “assign_variable” work, but is not what we are after. [3] [4]
Introducing: Excimer
Excimer is a small C program, with a binding for PHP 7. Its binding can be used to collect sampled stack traces. It leverages two low-level concepts that I’ll briefly describe on their own: POSIX timers, and graceful interrupts.
POSIX timers
With a POSIX timer, we directly ask the operating system to notify us after a given amount of time has elapsed. It can notify us in one of several ways. The timer can deliver signal events to a particular process or thread (which we could poll for). Or, the timer can respond by spawning a new concurrent thread in the process and run a callback there. This last option is known as SIGEV_THREAD.
Graceful interrupts
There is a vm_interrupt global flag in the PHP engine that the virtual machine checks during code execution. It’s not a very precise feature, but it is checked at least once before the end of any userland function, which is enough for our purpose.
If during such a check the engine finds that the flag is raised (set to 1 instead of 0), it resets the flag and runs any registered callbacks. The engine uses the same feature for enforcing request timeouts, and thus no overhead is added by using it to facilitate our sampling.
At last, we can start sampling!
When the Excimer profiler starts, it starts a little POSIX timer, with SIGEV_THREAD as the notification type. To give all code an equal chance of being sampled, the first interval is staggered by a random fraction of the sampling interval.
We’ll also give the timer the raw memory address where the vm_interrupt flag is located (you’ll understand why in a moment). The code to set up this timer is negligible and happens only once for a given web request. After that, the process is left to run as normal.
When the sampling interval comes around, the operating system spawns a new thread and runs Excimer’s timer handler. There isn’t a whole lot we can do from here since we’re in a thread alongside the PHP engine which is still running. We don’t know what the engine is up to. For example, we can’t safely and non-blockingly read the stack trace from here. Its memory may mutate at any time. What we do have is the raw address to the vm_interrupt flag, and we can boldly write a 1 there! No matter where the engine is at, that much is safe to do.
Not long after, PHP will reach one of its checkpoints and find the flag is raised. It resets the flag and makes a direct inline call to Excimer’s profiling code. Excimer simply reads out a copy of the stack trace, optionally flushing or sending it out, and then PHP resumes as normal.
If the process runs long enough to cover more than one sampling interval, the timer will notify us once more and the above cycle repeats.
Putting it all together
It’s time to put our sampling profiler to use!
- Collect – start the profiler and set a flush destination.
- Flush – send the traces someplace nice.
- Flame graphs – combine the traces and generate flame graphs.
Collect
The application can start the Excimer profiler with a sampling interval and flush callback.
static $prof = new ExcimerProfiler();
$prof->setPeriod(60); // seconds
$prof->setFlushCallback(function ($log) { ArcLamp::flush($log); });
$prof->start();
The above snippet is from Arc Lamp, as used on Wikipedia. This code would be placed in the early setup phase of your application. In PHP, this could also be placed in an auto_prepend_file that automatically applies to your web entry points, without needing any code or configuration inside the application.
Flush
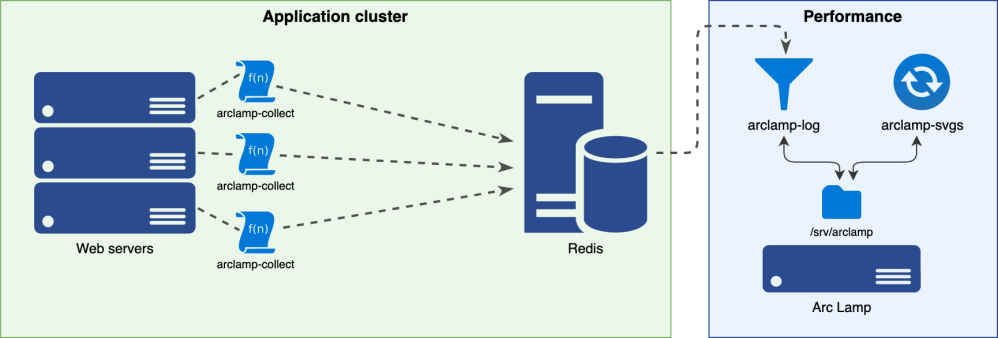
Next, we need to flush these traces to a place where we can find them later. This place needs to be reachable from all web servers, accept concurrent input at low latencies, and have a fast failure mode. I subscribe to the “boring technology” ethos, and so if you have existing infrastructure in use for something like this, I’d start with that. (e.g. ZeroMQ, or rsyslog/Kafka.)
At Wikimedia Foundation, we choose Redis for this. We ingest about 3 million samples daily from a cluster of 150 Apache servers in any given data centre, using a 60s sample interval. These are all received by a single Redis instance.
Flame Graphs
Arc Lamp consumes the Redis stream and writes the trace logs in batches to locally rotated files. You can configure how to split and join these. For example, we split incoming samples by “web”, “api”, or “job queue” entry point; and join by the hour, and by full day.
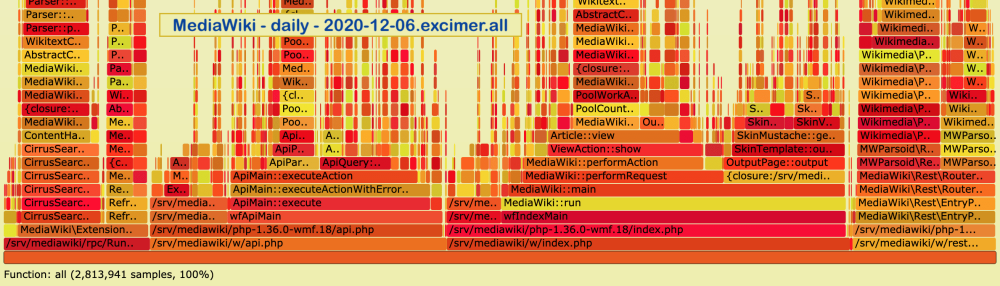
You can browse our daily flame graphs on performance.wikimedia.org, or check out the Arc Lamp and Excimer projects.
Thanks to: Tim Starling who single-handedly developed Excimer, Stas Malyshev for his insights on PHP internals, Kunal Mehta as Debian developer, and fellow Wikimedian who packaged Excimer, and Ori Livneh who originally created Arc Lamp and got me into all this.
Further reading
- How editing Wikipedia became twice as fast on HHVM, Ori Livneh, 2015.
- How Wikimedia Foundation successfully migrated to PHP 7, Effie Mouzeli, 2019.
- WikimediaDebug for PHP is here, Timo Tijhof, 2019.
- PHP Virtual Machine: vm_interrupt, Nikita Popov, 2017.
- Flame Graphs by Brendan Gregg.
- perf_events (Linux) on Wikipedia.
- PHP Internals Handbook: All about hooks.
- POSIX timer: notify options, Linux manual pages.
- Wikimedia Foundation: Site infrastructure.
Footnotes
- We already used XHProf as a debugger for capturing complete and unsampled profiles over a single web request. The original php-xhprof targeted PHP 5. When we migrated to HHVM, we continued using its built-in port of XHProf. We since migrated to PHP 7 and use php-tideways, which is a maintained alternative with PHP 7 support. The original xhprof has since published an experimental branch with tentative PHP 7 support. ↩︎
- See also Poor man’s contention profiling (Domas Mituzas, 2009), in which GDB is used to profile a MySQL server. ↩︎
- If the VM runtime includes a JIT compiler, then perf_events could be used still. With a JIT compiler, the runtime compiles your source code into machine code, which then becomes a native part of the VM’s process. The VM would call these unnamed chunks of machine code directly by their memory address. This is a bit like how “eval” can create functions in a scripting language. You then need a perf.map file so that perf_events can turn these unnamed addresses back into the names of classes and methods from which a chunk of code originated. This is known as symbol translation. There is support for perf map files in Node.js and Java. ↩︎
- PHP 8.0 was announced last week and includes a new JIT with perf.map support. I look forward to exploring this over the coming year! ↩︎
About this post
This post was originally published on 11 December 2020 in the Performance Calendar.
Featured image credit: Chess board fireplace by Armando Olivo Martín del Campo, CC BY-SA 4.0
Hey,
Really nice post, thanks for sharing.