

Web Perf Hero: Valentín Gutierrez
By Timo Tijhof
I’m happy to share that the second Web Perf Hero award of 2022 goes to Valentín Gutierrez!
This award is in recognition of Valentín’s work on the Wikimedia CDN over the past three months. In particular, Valentín dove deep into Apache Traffic Server. We use ATS as the second layer in our HTTP Caching strategy for MediaWiki. (The first layer is powered by Varnish.)
Cache miss
Valentín (@Vgutierrez) observed that ATS was treating many web requests as cache misses, despite holding a seemingly matching entry in the cache. To understand why, we have to talk about the Vary header.
If a page is served the same way to everyone, it can be cached under its URL and served as such to anyone navigating to that same URL. This is nearly true for us from a statistical viewpoint, except that we have editors with logged-in sessions, whose pageviews must bypass the CDN and its static HTML caches. In HTTP terminology, we say that MediaWiki server responses “vary” by cookies. Two clients with different cookies may get a different response. Two clients with the same cookies, or with no cookies, can enjoy the same cached response. But, log-in sessions aren’t the only cookies in town! For example, our privacy-conscious device counting metric also utilizes a cookie (“WMF-Last-Access”). It is a very low entropy cookie, but a cookie nonetheless. We also optionally use cookies for fundraising localisation, and various other JavaScript features. As such, a majority of connecting browsers will have at least one cookie.
The HTTP specification says that when a response for a URL varies by the value of a header (in our case, the Cookies header controls whether you’re logged-in), then cache proxies like ATS and Varnish must not re-use a cache entry, unless the original and current browser have the exact same cookies. For the cache to be effective, though, we must pay attention to the session cookie only, and ignore cookies related to metrics and JavaScript. For our Varnish cache, we do exactly that (through custom VCL code), but we never did this for ATS.
And so work began to implement Lua code for ATS to identify session cookies, and treat all other cookies as if they don’t exist — but only within the context of finding a match in the cache, restoring them right after.
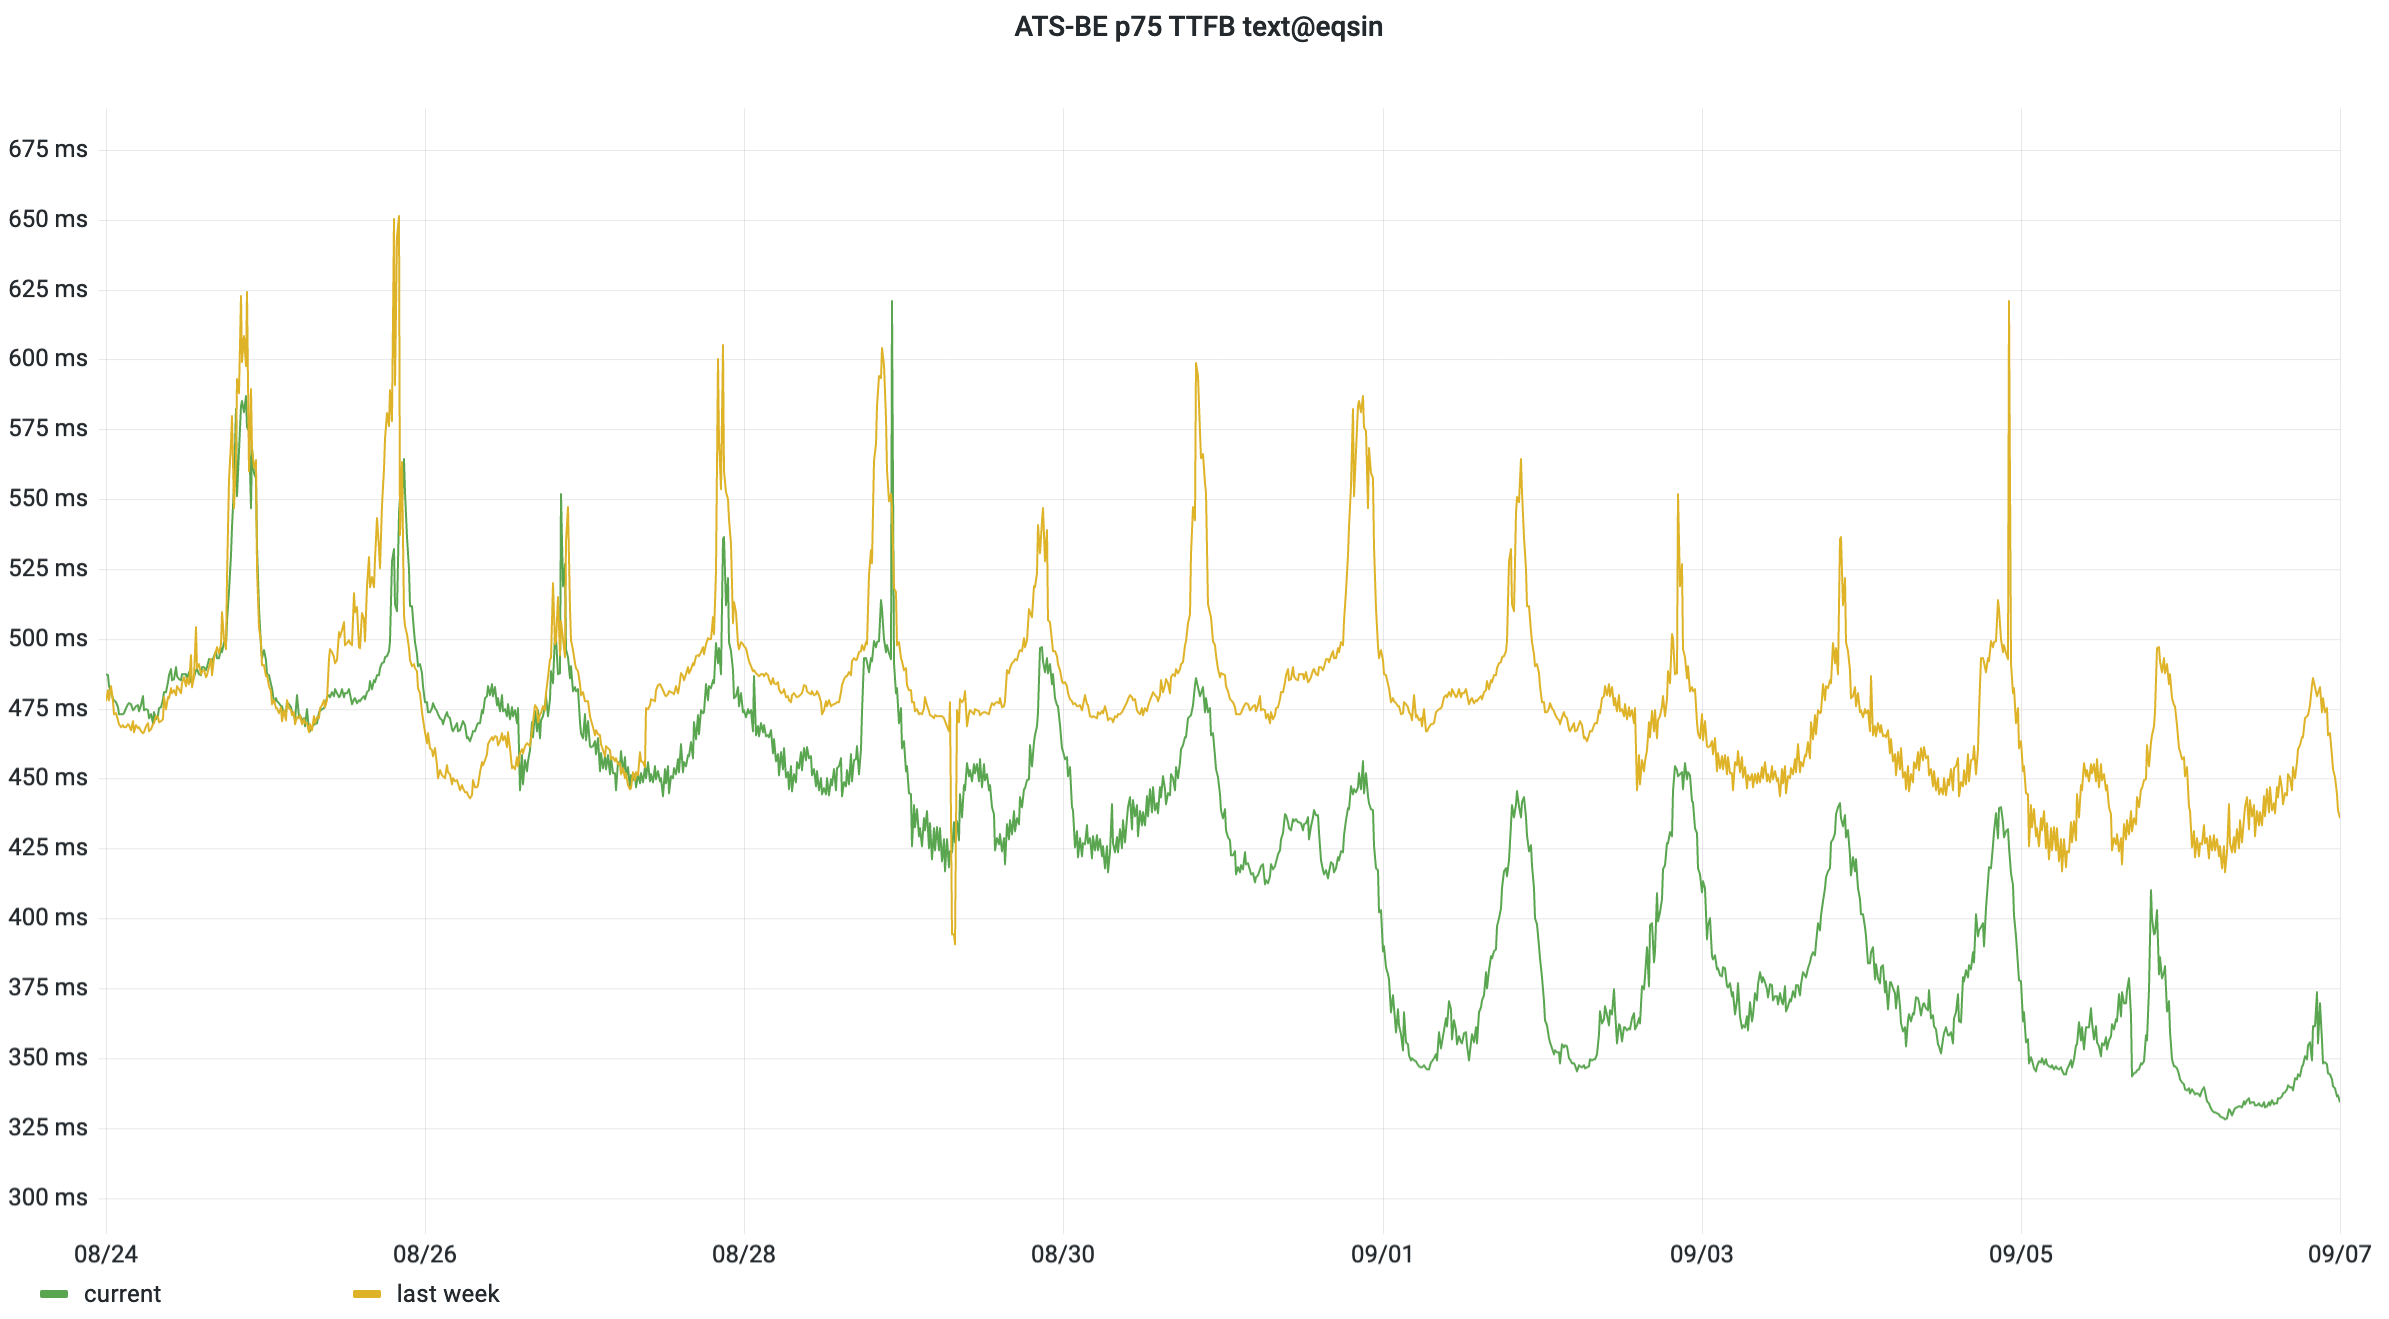
In our Singapore data center, our ATS latency improved by 25% at the p75, e.g. from 475ms down to 350ms compared to the same time and day a week earlier. That’s a 125ms drop, which is one of the biggest reductions we’ve ever documented!
The reduction is due to more requests being served directly from the cache, instead of generating new pageviews for each combination of unrelated cookies. We can also measure this as a ratio between cache hits and cache misses — the cache hit ratio. For the Amsterdam data center, ATS cache hits went from ~600/s to 1200/s. As a percentage of all backend traffic, that’s from 2% to 4%. (The CDN frontend enjoys a cache hit ratio of 90-99% depending on entrypoint.)

Disk reads
In September, Valentín created a Grafana dashboard to explore metrics from internal operations within ATS. This is part of on-going work to establish a high-level SLO for ATS. ATS reads from disk as part of serving a cache hit. Valentín discovered that disk reads were regularly taking up to a whole second.
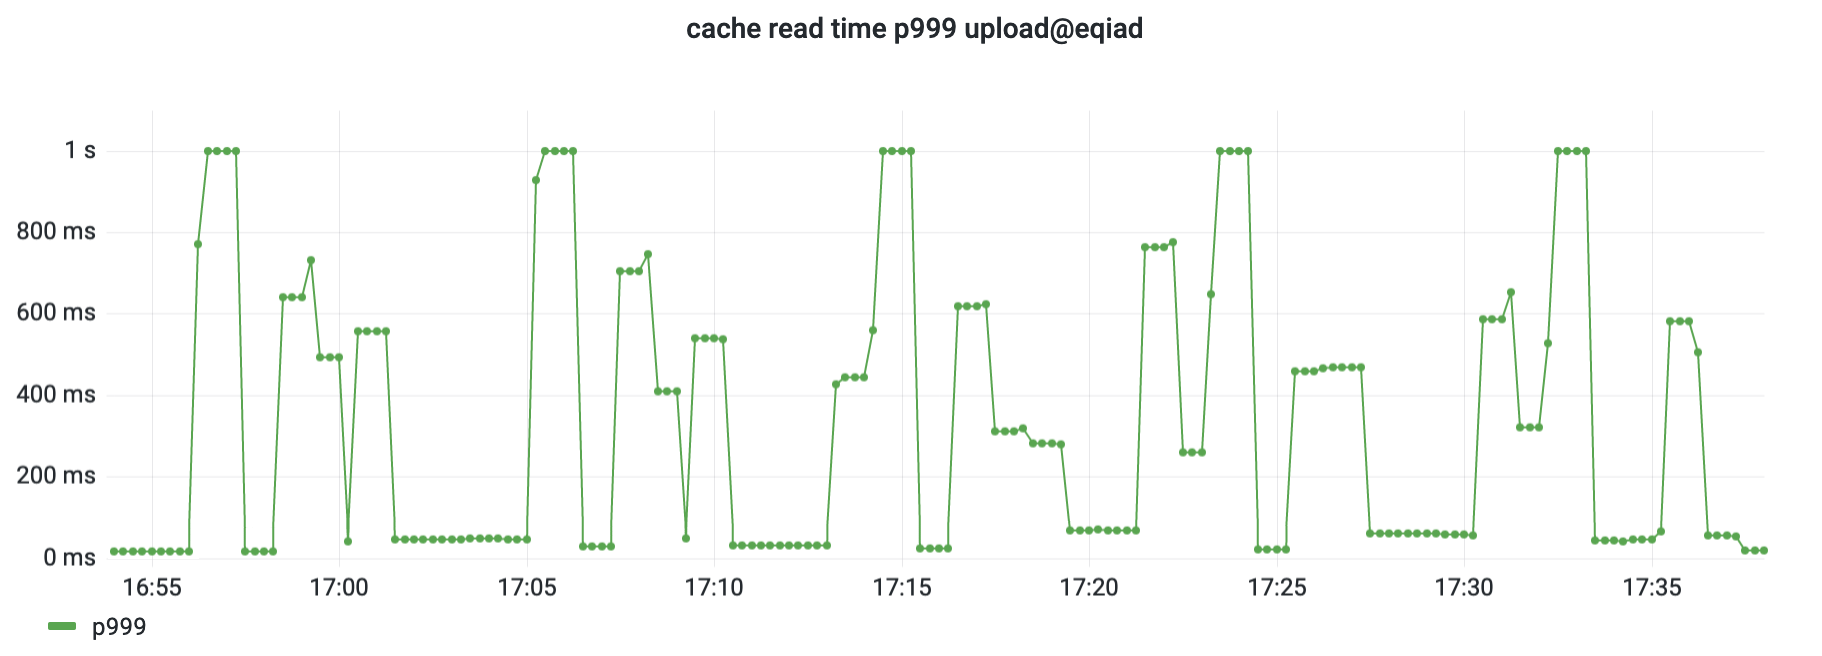
Most traffic passing through ATS is a cache miss, where we respond within 300ms at the p75 (latency shown earlier). For the subset where we serve a cache hit at the ATS layer, we generally respond within ~5ms, magnitudes faster. When we observed a cache hit taking 1000ms to respond, that is not only very slow, it is also notably slower than generating a fresh page from a MediaWiki server.
After ruling out timeout-related causes, Valentín traced the issue to the ATS cache_dir_sync operation. This operation synchronizes metadata about cache entries to disk, and runs once every few minutes. It takes about one minute, during which we consistently saw 0.1% of requests experience the delay. Cache reads had to wait for a safety lock held by a single sync for the entire server. Valentín worked around the issue by partitioning the cache into multiple volumes, with the sync (and its lock) applying only to a portion of the data. These are held for a shorter period of time, and less likely to overlap with a cache read in the first place. (our investigation, upstream issue)
On most ATS servers, the cache read p999 dropped from spiking at 1000ms down to a steady 1ms. That’s a 1000X reduction!
Note that this issue was not observable through the 75th percentile measure, because each minute affected a different 0.1% of requests, despite happening consistently throughout the day. This is why we don’t recommend p75 for backend objectives. Left continuously, much more than 0.1% of clients would experience the issue. Resolving this avoids a constant spending of the error budget SLO, preserving our budget for more unusual and unforeseen issues down the line.
Web Perf Hero award
The Web Perf Hero award is given to individuals who have gone above and beyond to improve the web performance of Wikimedia projects. The initiative is led by the Performance Team and started mid-2020. It is awarded quarterly and takes the form of a Phabricator badge.
Read about past recipients at Web Perf Hero award on Wikitech.