Flame graphs arrive in WikimediaDebug
The new “Excimer UI” option in WikimediaDebug generates flame graphs. What are flame graphs, and when do you need this?
A flame graph visualizes a tree of function calls across the codebase, and emphasizes the time each function spends. In 2014, we introduced Arc Lamp to help detect and diagnose performance issues in production. Arc Lamp samples live traffic and publishes daily flame graphs. This same diagnostic power is now available on-demand to debug sessions!
Debugging until now
WikimediaDebug is a browser extension for Firefox and Chromium-based browsers. It helps stage deployments and diagnose problems in backend requests. It can pin your browser to a given data center and server, send verbose messages to Logstash, and… capture performance profiles!
Our main debug profiler has been XHGui. XHGui is an upstream project that we first deployed in 2016. It’s powered by php-tideways under the hood, which favors accuracy in memory and call counts. This comes at the high cost of producing wildly inaccurate time measurements. The Tideways data model also can’t represent a call tree, needed to visualize a timeline (learn more, upstream change). These limitations have led to misinterpretations and inconclusive investigations. Some developers work around this manually with time-consuming instrumentation from a production shell. Others might repeatedly try fixing a problem until a difference is noticeable.
Accessible performance profiling
Our goal is to lower the barrier to performance profiling, such that it is accessible to any interested party, and quick enough to do often. This includes reducing knowledge barriers (internals of something besides your code), and mental barriers (context switch).
You might wonder (in code review, in chat, or reading a mailing list) why one thing is slower than another, what the bottlenecks are in an operation, or whether some complexity is “worth” it?
With WikimediaDebug, you flip a switch, find out, and continue your thought! It is part of a culture in which we can make things faster by default, and allows for a long tail of small improvements that add up.
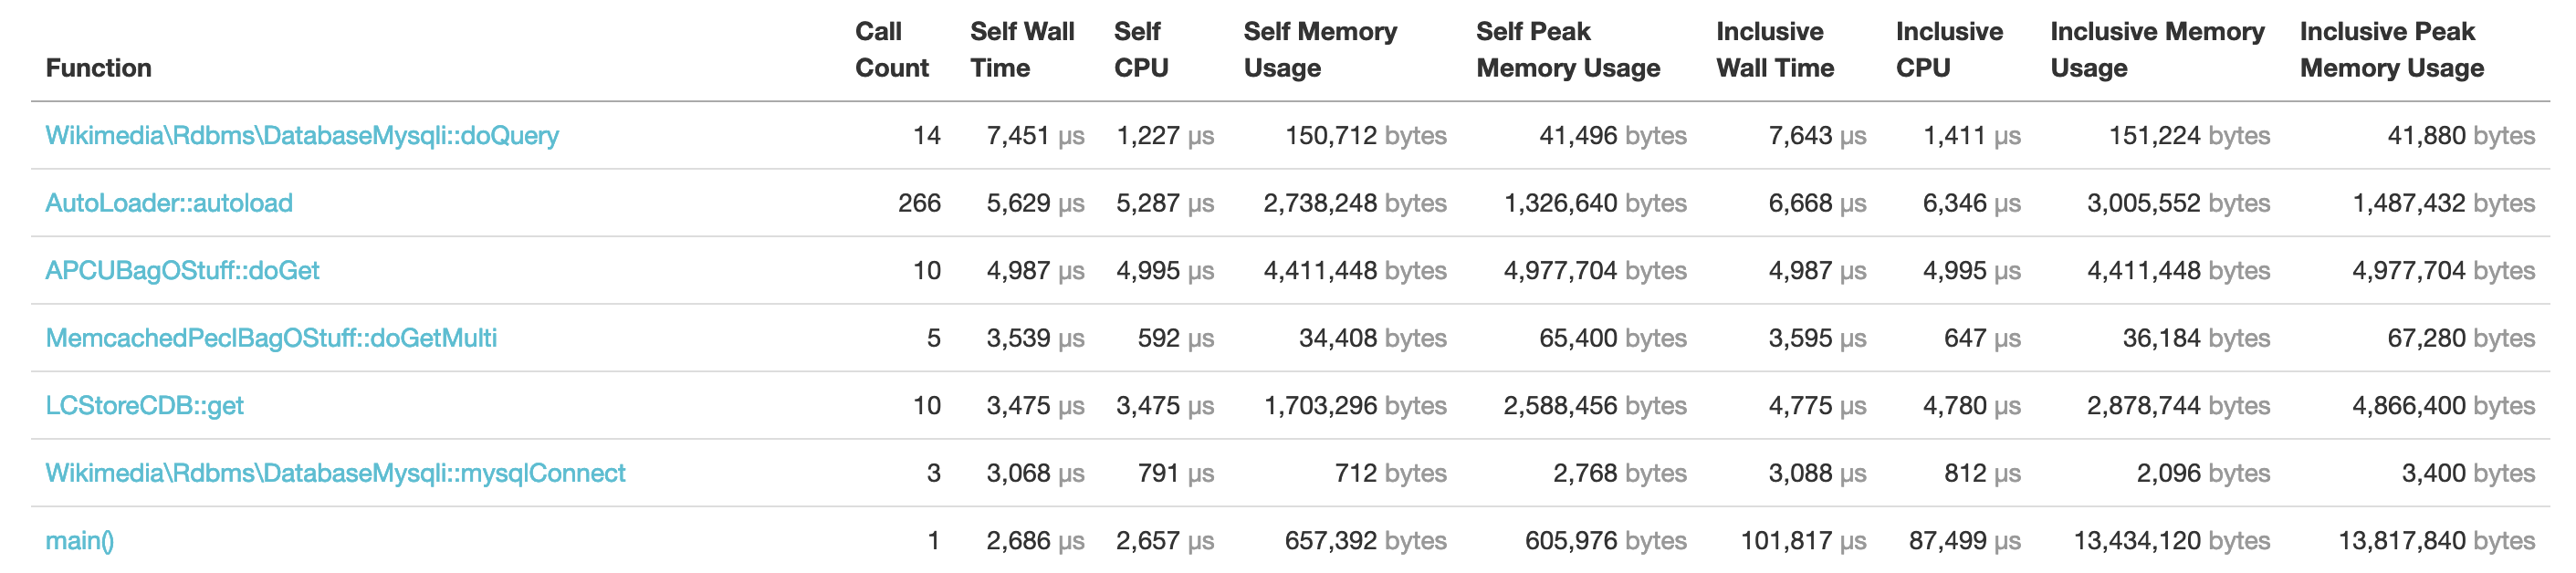
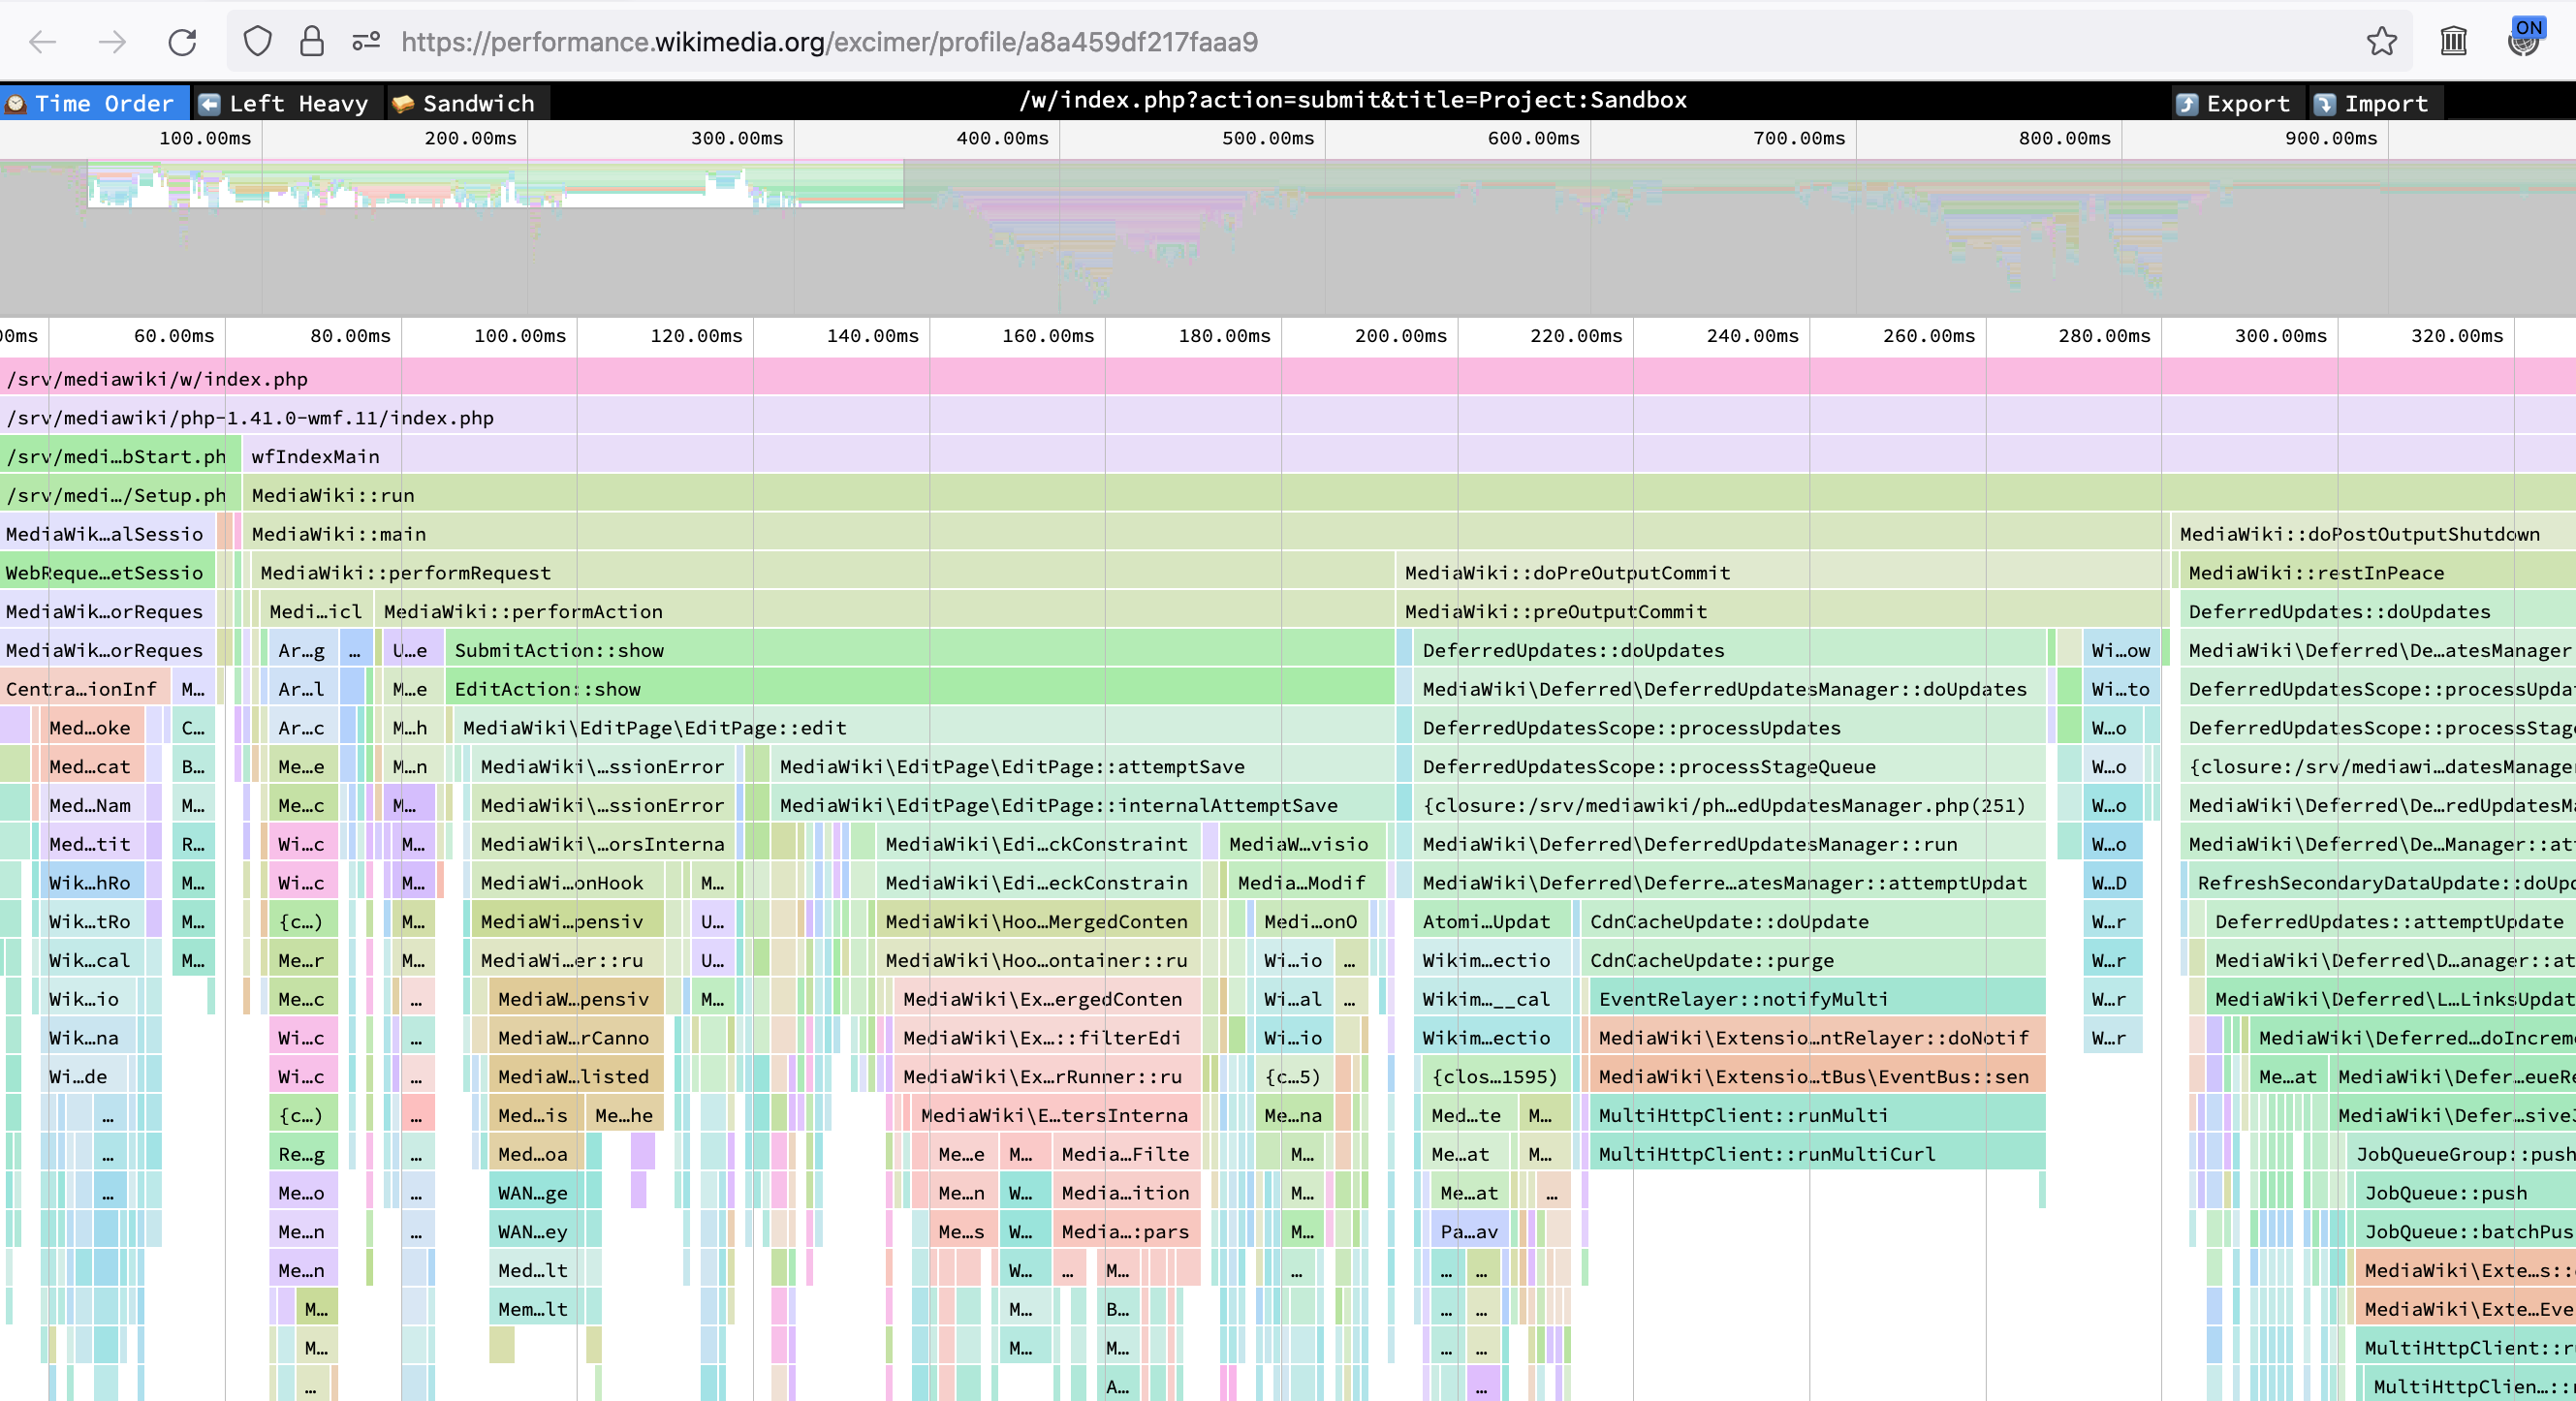
Example: In reviewing a change, which proposes adding caching somewhere, I was curious. Why is that function slow? I opened the feature and enabled WikimediaDebug. That brought me to an Excimer profile where you can search (ctrl-F) for the changed function (“doDomain”). We find exactly how much time is spent in that particular function. You can verify our results, or capture your own!
What: Production vs Debugging
We measure backend performance in two categories: production and debugging.
“Production” refers to live traffic from the world at large. We collect statistics from MediaWiki servers, like latency, CPU/memory, and errors. These stats are part of the observability strategy and measure service availability (“SLO”). To understand the relationship between availability and performance, let’s look at an example. Given a browser that timed out after 30 seconds, can you tell the difference between a response that will never arrive (it’s lost), and a response that could arrive if you keep waiting? From the outside, you can’t!
When setting expectations, you thus actually define both “what” and “when”. This makes performance and availability closely intertwined concepts. When a response is slower than expected, it counts toward the SLO error budget. We do deliver most “too slow” responses to their respective browser (better than a hard error!). But above a threshold, a safeguard stops the request mid-way, and responds with a timeout error instead. This protects us against misuse that would drain web server and database capacity for other clients.
These high-level service metrics can detect regressions after software deployments. To diagnose a server overload or other regression, developers analyze backend traffic to identify the affected route (pageview, editing, login, etc.). Then, developers can dig one level deeper to function-level profiling, to find which component is at fault. On popular routes (like pageviews), Arc Lamp can find the culprit. Arc Lamp publishes daily flame graphs with samples from MediaWiki production servers.
Production profiling is passive. It happens continuously in the background and represents the shared experience of the public. It answers: What routes are most popular? Where is server time generally spent, across all routes?
“Debug” profiling is active. It happens on-demand and focuses on an individual request—usually your own. You can analyze any route, even less popular ones, by reproducing the slow request. Or, after drafting a potential fix, you can use debugging tools to stage and verify your change before deploying it worldwide.
These “unpopular” routes are more common than you might think. Wikipedia is among the largest sites with ~8 million requests per minute. About half a million are pageviews. Yet, looking at our essential workflows, anything that isn’t a pageview has too few samples for real-time monitoring. Each minute we receive a few hundred edits. Other workflows are another order of magnitude below that. We can take all edits, reviews of edits (“patrolling”), discussion replies, account blocks, page protections, etc; and their combined rate would be within the error budget of one high-traffic service.
Excimer to the rescue
Tim Starling on our team realized that we could leverage Excimer as the engine for a debug profiler. Excimer is the production-grade PHP sampling profiler used by Arc Lamp today, and was specifically designed for flame graphs and timelines. Its data model represents the full callstack.
Remember that we use XHGui with Tideways, which favors accurate call counts by intercepting every function call in the PHP engine. That costly choice skews time. Excimer instead favors low-overhead, through a sampling interval on a separate thread. This creates more representative time measures.
Re-using Excimer felt obvious in retrospect, but when we first deployed the debug services in 2016, Excimer did not yet exist. As a proof of concept, we first created an Excimer recipe for local development.
How it works
After completing the proof of concept, we identified four requirements to make Excimer accessible on-demand:
- Capture the profiling information,
- Store the information,
- Visualize the profile in a way you can easily share or link to,
- Discover and control it from an interface.
We took the capturing logic as-is from the proof of concept, and bundled it in mediawiki-config. This builds on the WikimediaDebug component, with an added conditional for the “excimer” option.
To visualize the data we selected Speedscope, an interactive profile data visualization tool that creates flame graphs. We did consider Brendan Gregg’s original flamegraph.pl script, which we use in Arc Lamp. flamegraph.pl specializes in aggregate data, using percentages and sample counts. This is great for Arc Lamp’s daily summaries, but when debugging a single request we actually know how much time has passed. It would be more intuitive to developers if we presented the time measurements, instead of losing that information. Speedscope can display time.
We store each captured profile in a MySQL key-value table, hosted in the Foundation’s misc database cluster. The cluster is maintained by SRE Data Persistence, and also hosts the databases of Gerrit, Phabricator, Etherpad, and XHGui.
Freely licensed software
We use Speedscope as the flame graph visualizer. Speedscope is an open source project by Jamie Wong. As part of this project we upstreamed two improvements, including a change to bundle a font rather than calling on a third-party CDN. This aligns with our commitment to privacy and independence.
The underlying profile data is captured by Excimer, a low-overhead sampling profiler for PHP. We developed Excimer in 2018 for Arc Lamp. To make the most of Speedscope’s feature set, we added support for time units and added the Speedscope JSON format as a built-in output type for Excimer.
We added Excimer to the php.net registry and submitted it to major Linux package managers (Debian, Ubuntu, Sury, and Remi’s RPM). Special thanks to Kunal Mehta as Debian Developer and fellow Wikimedian who packaged Excimer for Debian Linux. These packages make Excimer accessible to MediaWiki contributors and their local development environment (e.g. MediaWiki-Docker).
Our presence in the Debian repository carries special meaning. Presence in the Debian repository signals trust, stability, and confidence in our software to the free software ecosystem. For example, we were pleased to learn that Sentry adopted Excimer to power their Sentry Profiling for PHP service!
Try it!
If you haven’t already, install WikimediaDebug in your Firefox or Chrome browser.
- Navigate to any article on Wikipedia.
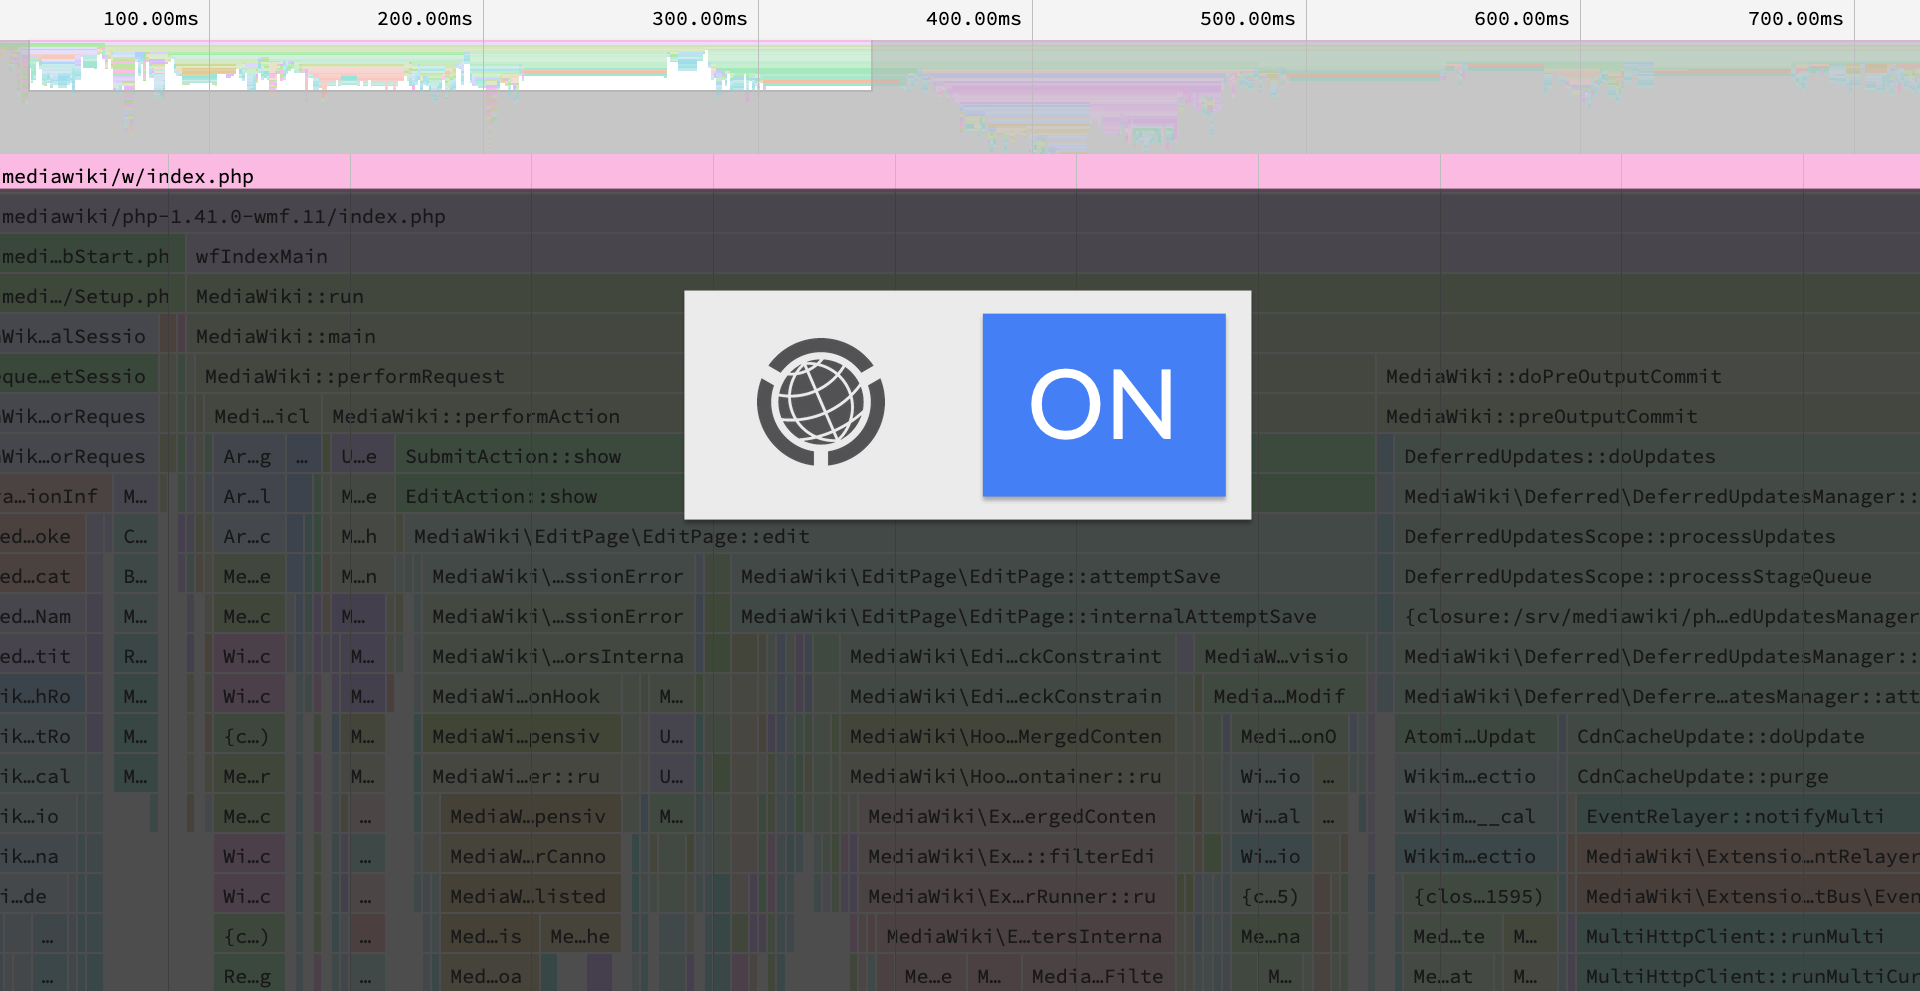
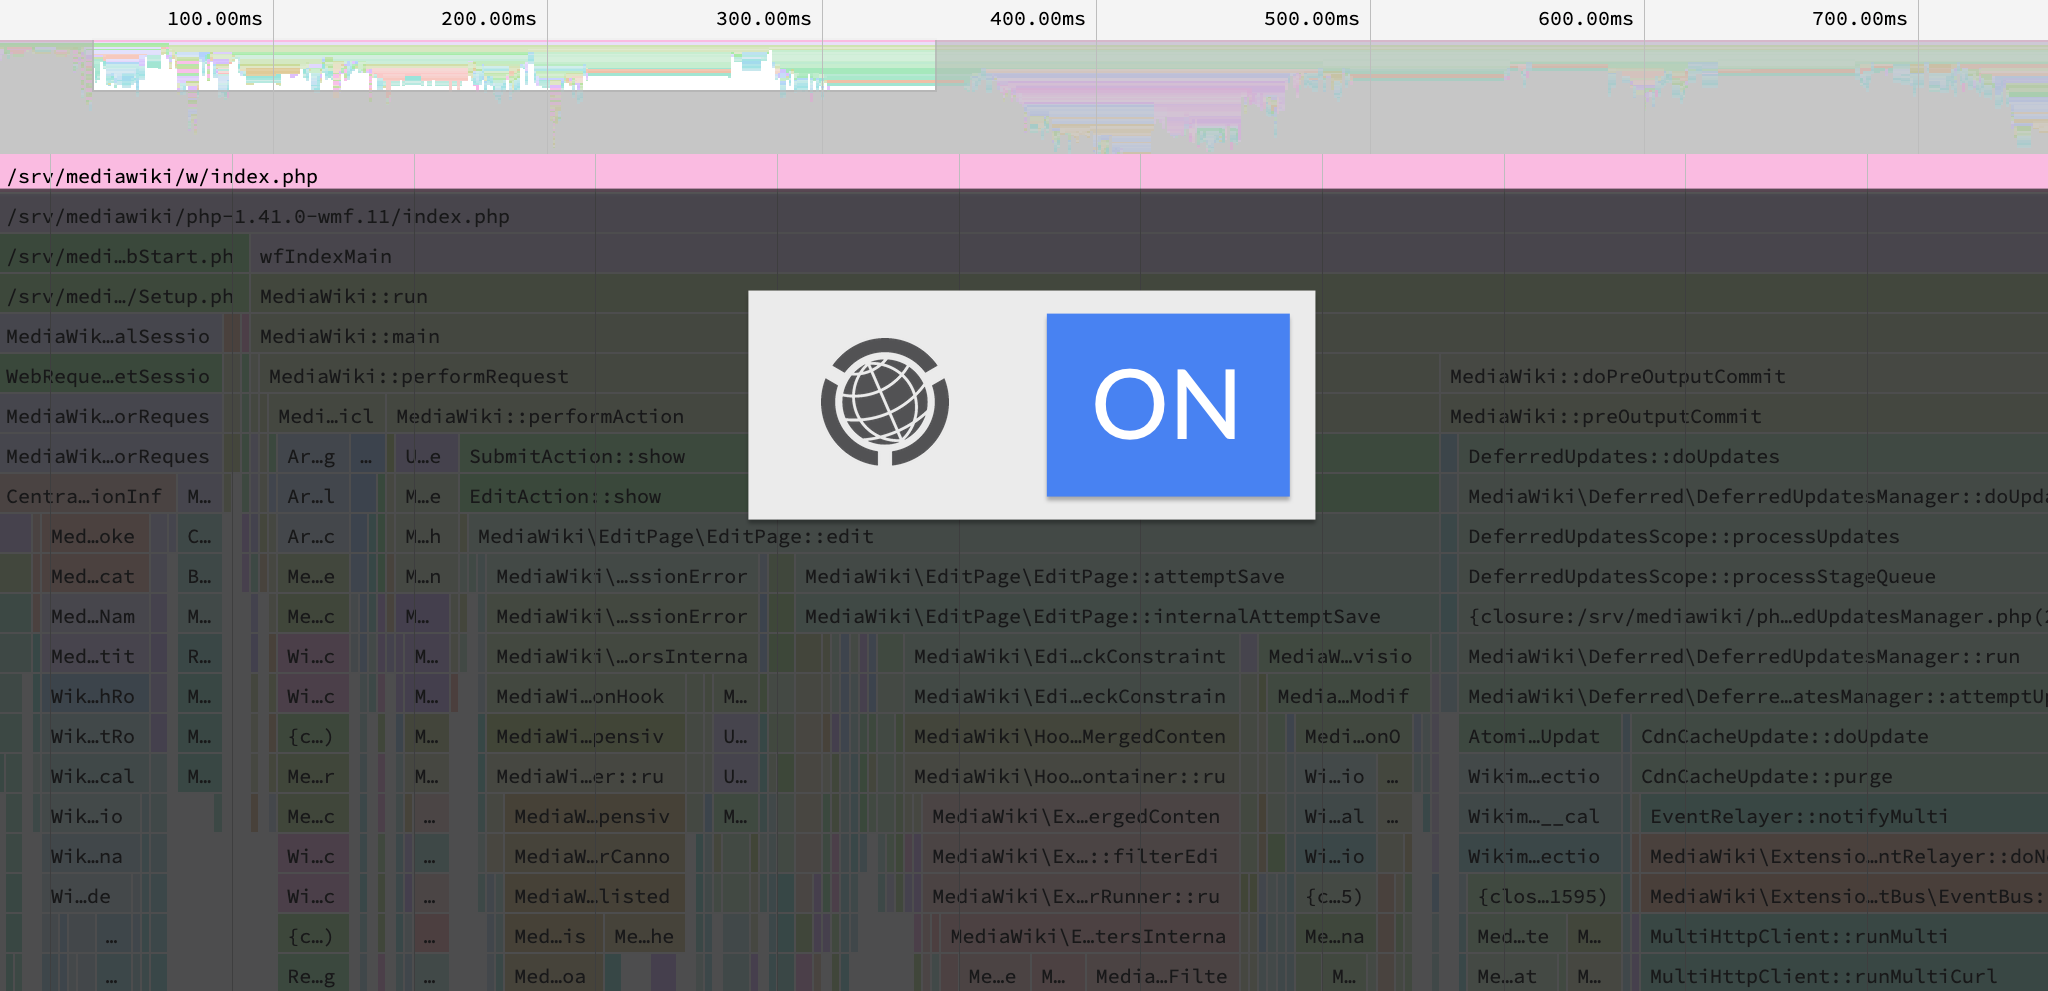
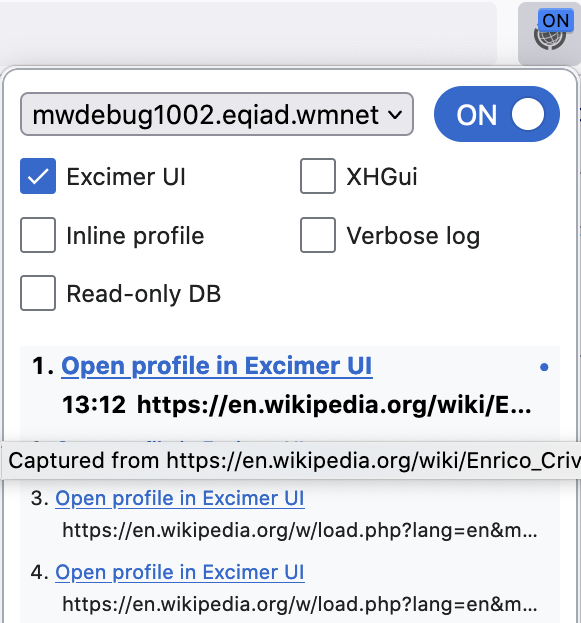
- Set the widget to On, with the “Excimer UI” checked.
- Reload the page.
- Click the “Open profile” link in the WikimediaDebug popup.
Accessible debugging tools empower you to act on your intuitions and curiosities, as part of a culture where you feel encouraged to do so. What we want to avoid is filtering these intuitions down to big incidents only, where you can justify hours of work, or depend on specialists.
Further reading:
- Excimer: Profiling PHP in production at scale, Techblog, 2021.
- How does WikimediaDebug work?, Techblog, 2019.
- T291015: Add per-request flame graph to WikimediaDebug.