Perf Matters at Wikipedia in 2017
Reduce Wikipedia’s time-to-logo

Thanks to the new Preload web standard developed by the W3C WebPerf working group, we were able to reduce the time-to-logo metric on Wikipedia. Research and development was led by Gilles Dubuc (T100999) and involved some unique challenges.
Read more at Improving time-to-logo performance with preload.
The initial version of the standard did not support variants for high pixel density (e.g. a “2x” version for HiDPI Retina screens). This meant it would either preload the low-res version (and be unused waste on most devices where we actually request the high-res version), or preload the high-res version and experience the inverse problem. To workaround this, we used a set of mutually-exclusive CSS media queries, which are supported inside the HTTP Preload header!
We discussed this with the WebPerf WG at W3C, where Timo registered interest on behalf of Wikimedia Foundation for the “link-imagesrcset” feature. The feature got standardized in 2018, and was released in browsers as of Firefox 78 and Chrome 73. This and other experiences led us to join the W3C in 2019.
Research reverse proxies for more stable metrics
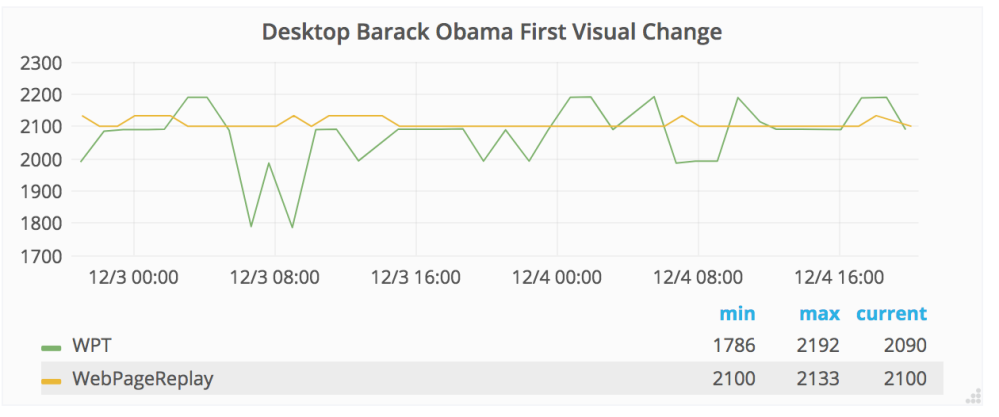
Peter Hedenskog introduced synthetic performance testing at Wikimedia in 2015, through continuous automation and monitoring with WebPageTest. Metrics from WebPageTest instances have a relatively high variance, which places the threshold for detecting changes higher than we’d like. It meant only large regressions could be reliably detected.
The Firefox team at Mozilla and the Chromium team each test their browsers prior to release. They actually each use a form of “record and replay” proxy to create more stable metrics, by removing variance in speed from one moment to the next when requesting pages across the public Internet. We evaluated three proxies: Mahimahi (doesn’t support HTTP/2), WebPageReplay (built by the Chromium team), and mitmproxy (used by Firefox team).
We deployed our synthetic test configuration at several cloud providers and on bare metal providers to determine where the browser performance has the least variance between runs (based on page load time and SpeedIndex). In other words, not which is the fastest, but where CPU performance is most stable and consistent over time. We ran tests at AWS, Google Cloud, DigitalOcean, Wikimedia Cloud VPS (OpenStack), and a bare metal server in a Wikimedia Foundation data center.
We selected WebPageReplay hosted on AWS, as this combination gave us the most stable metrics. Research by Gilles Dubuc and Peter Hedenskog in T153360, T176361, and T165626.
Read more at Performance testing in a controlled lab environment

Reduced Page Load Time
This year saw a major reduction in page load time thanks to further adoption of Preload in ResourceLoader.
ResourceLoader is Wikipedia’s delivery system for CSS, JavaScript, and localization. Its JavaScript bundler works in two stages to improve HTML cache performance. Stage one (“startup”) and stage two (“page modules”). Stage one is served from a stable URL with a small payload that is cached for a short period of time, and is referenced from the HTML. Stage two is requested by JavaScript at runtime based on dependencies and module versions transmitted by the startup manifest in stage one.
This means that we cannot direct the browser from the HTML document to preload the second stage.
However, while not common in the wild, the HTTP Preload feature is designed to work on any HTTP response, not just on HTML documents. This means we can still achieve a considerable speed-up by adding a Preload HTTP header to the JavaScript response of the startup manifest, with a server-side computed URL based on the information in that same manifest.
Page load time was reduced by a whole second, from 14s to 13s, as measured using the 3G-Slow connection profile. Research and development led by Timo Tijhof. View source and learn more at T164299.


Reduced Save Timing
Is it faster to save articles on Wikipedia than it was a year ago?
Aaron Schulz has continued to lead numerous improvements. We last reported on this in Perf Matters 2015.
25% improvement at the p99, from 22.4 to 16.82 seconds.
15% improvement at the median, from 953 to 813 milliseconds
Read more at Looking back: improvements to edit save time
Prepare for Singapore caching data center
In the lead up to Wikimedia’s fifth data center going live, we’ve put numerous measurements in place to accurately capture the before and after, and quantify the impact.
Peter expanded our synthetic testing to include several agents across the Asian continent (T168416). Gilles developed a geographic oversampling capability for our real-user monitoring (T169522).
Read more at New Singapore DC helps people access Wikipedia around the globe.
Profiling PHP at scale with Excimer
Back in 2014 when we deployed HHVM, and editing became twice as fast, we were very happy to utilize the Xenon sampling profiler built-in to HHVM to power continuous flame graphs that enable us to detect regressions and identify and verify opportunities for improvements.
As part of the migration from HHVM to PHP 7 this year, we set out to find or create a low-overhead sampling profiler for PHP 7. This included Tim Starling developing php-excimer (T176916).
Read more at Profiling PHP in production at scale.
Miscellaneous
- Implement a performance alerting system atop Grafana. Establish it as a practice for other teams to follow. Two teams used it in the first year. T153169
- Develop new “navtiming2” metric definitions, addressing what we learned since 2015, and enable use of stacked graphs (T104902).
Further reading
- Perf Matters at Wikipedia in 2016
- Perf Matters at Wikipedia in 2015
- Automating Performance Regression Alerts (2017), Peter Hedenskog (Web Performance Calendar).
- Investigating a performance improvement (2017), Gilles Dubuc.
- Journey to Thumbor: 3-part blog series (2017), Gilles Dubuc.
About this post
Feature image by PxHere, licensed CC0, via Wikimedia Commons.

